Authored by Lance Roberts via RealInvestmentAdvice.com,
For the last couple of months, we have discussed the risk of the narrowing of leadership as money piled into an ever reducing number of primarily large-cap technology stocks. To wit:
“This really is a more bizarre clustering of markets and sectors that I have witnessed in quite some time. However, for now, the rotation between sectors remains tight and it is the #FANMAG stocks that continue to elevate markets because of their sheer size. ($FB, $AAPL, $NFLX, $MSFT, $AMZN, $GOOG)
The question that continues to linger over the markets is just how stable is the advance? The answer to that question is unclear, but it is quite likely the spat of earnings growth seen over the last couple of quarters will soon end as year-over-year comparisons get decidedly tougher.”
Last Friday, a news headline questioning valuation levels triggered algorithmic trading programs to reverse and dump those stocks in mass.
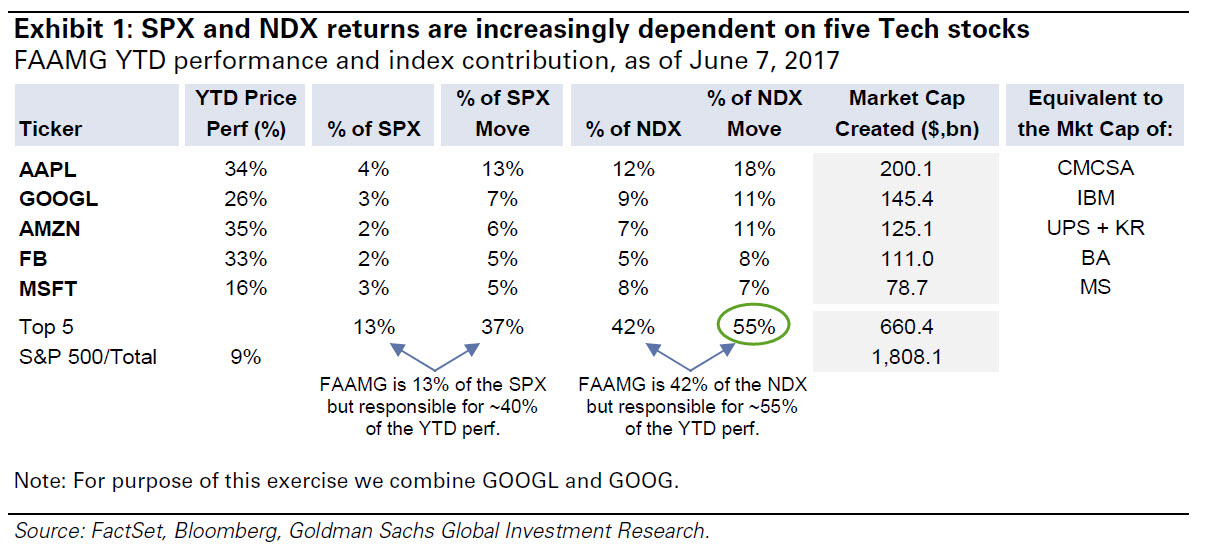
“Goldman’s Robert Bouroujerdi writes that ‘while FANG has dominated investor focus, the nature of the acronym has expanded more broadly to encompass mega-cap tech. Indeed, the bigger story in our view is FAAMG – Facebook, Amazon, Apple, Microsoft, and Alphabet – a group of five stocks which have been the key drivers of both the SPX & NDX returns year-to-date. This outperformance, driven by secular growth and the death of the reflation narrative, has created positioning extremes, factor crowding and difficult-to-decipher risk narratives (e.g. FAAMG’s realized volatility is now below that of Staples and Utilities).
The run in large-cap tech stocks (with the top 5 accounting for a stunning 55% of the Nasdaq’s YTD gains) has evoked memories (nightmares?) for some investors of the last euphoric NASDAQ run.”
“Goldman notes that downside risk increases when factor valuations are stretched vs. history. To that end, the current P/E of the long/short Momentum factor is 1.8 std. deviations above its 3-year average, which is a level last seen in early 2016 just prior to ‘Factormageddon’ – a period in late Q1:16 when the momentum factor fell sharply amidst a spike in factor volatility.”
While the valuation call sent algo’s into “selling mode,” the “bloodbath” in Technology and Discretionary stocks, as shown below, was simply a reversion to 50-day mean following an extreme deviation.
[image]https://realinvestmentadvice.com/wp-content/uploads/2017/06/XLK-XLY-061617.png[/image]
It is worth noting that the 50-dma has been critical support for these sectors so a downside violation of that support would be important to pay attention to.
However, stepping back from the sector-specific action, if you only looked at the S&P 500 to judge what was happening in the markets, you wouldn’t suspect anything was wrong.
[image]https://realinvestmentadvice.com/wp-content/uploads/2017/06/SP500-Chart1-061617.png[/image]
The market breakout remains intact currently with support at 2400 holding firm. The bullish trend line, which also intersects at 2400 remains critically important as the secondary buy/sell signal remains in positive territory. The only negative currently, despite improvement, is the “weekly sell signal-1” remains triggered which keeps us on “alert.” (It is also worth noting both signals remain at VERY high levels which suggest current upside remains somewhat limited.)
You can understand why more and more commentary is beginning to succumb to the “siren’s song” of why “this time is different.” Whether it is terrorist attacks, poor economic data, geopolitical tensions, or plunging oil prices, the market has continued its advance. It certainly seems to be “bulletproof.”
But therein lies the problem.
The longer the market remains seemingly “bulletproof,” the greater the complacency becomes with investors. This complacency, or lack of fear, leads to an unwitting rise in the “riskiness” of portfolio allocations as the “can’t lose” markets draws more and more capital out of “safety” and into “risk.” As noted last week, valuations, equity allocation, and negative “free cash” balances are pushing extremes.
[image]https://realinvestmentadvice.com/wp-content/uploads/2017/06/Measures-Of-Exuberance-061117.jpg[/image]
Historically speaking, such levels of exuberance have tended to have poor outcomes for investors who did not realize the level of “speculative risk” that had built up in portfolios over time.
[image]https://realinvestmentadvice.com/wp-content/uploads/2017/06/SP500-Comparison-061617.png[/image]
This “time” will not turn out any differently – it is just the “timing” and the “catalyst” that will be.
Volatility, Markets & Fed Unwinding
Last week the Fed hiked their lending rate 1.25% which is the highest level since the financial crisis. More importantly, they announced they will consider beginning to allow their $4.5 Trillion balance sheet to begin to reduce by not “reinvesting” proceeds from redemptions and interest payments.
First, just so you know, the Fed’s balance sheet inflates two important things besides asset prices: 1) corporate profits, and 2) government revenues.
I addressed in “Earnings Vs. Profits & The Bull Market” the impact of the Fed’s balance sheet on corporate revenues. To wit:
“The profits generated by the Federal Reserve’s balance sheet are included in the corporate profits discussed here. As shown below, actual corporate profitability is weaker if you extract the Fed’s profits from the analysis. As a comparison, in the first quarter of 2017, Apple reported a net income of just over $17 billion for the quarter. The Fed reported a $109 billion profit.”
[image]https://realinvestmentadvice.com/wp-content/uploads/2017/06/Corporate-Profits-Less-Fed-Reserve-060417.png[/image]
With respect to government revenues, it is also not a minor issue. The Federal Reserve can NOT buy bonds directly from the Treasury. When the Treasury issues bonds to fund the difference between Government revenues and expenses, the deficit, those bonds are sold to the 20-primary dealers. When the Fed is active doing “Quantitative Easing,” the Fed creates a “swap” with the primary dealer by crediting their reserve account and the Fed now owning the bonds.
Here is the interesting thing. When the Treasury pays the interest on the bonds, that interest is accounted for as an “expense” for the Government. Periodically, the Fed remits “profits” back to the Treasury which is essentially returning to the Treasury the interest payments received by the Fed. These profits, or returned interest payments, are then counted as “revenue” for the Government.
How much is that you ask? In 2016, it was $92.7 Billion which was slightly lower than the previous record of $97.7 Billion in 2015 which was up from $96.9 Billion in 2014. So, in the years ahead, as the Fed reduces their balance sheet, the income to the Treasury will also fall.
I digress.
Now, nearly a decade after the start of the financial crisis, the Fed has announced its plan for shrinking the size of its balance sheet. From BI:
“The basic idea is that the Fed will stop reinvesting the principal of securities when they mature.
Put another way, when a 10-year Treasury on the Fed’s books comes due, the money it gets back from that investment will not be used to go out and buy another Treasury.
The slowing of reinvestment will be phased in over time. To start, the Fed will invest money back into the market only if it gets back more than $6 billion in principal returned a month. From there, the ‘cap’ will increase by $6 billion every three months over the course of a year until it hits $30 billion a month.
The Fed said it would ultimately have a balance sheet ‘appreciably below that seen in recent years but larger than before the financial crisis’ in part because the Fed expects banks to maintain higher demand for reserves supplied by the central bank. But that is a pretty broad endpoint given that the Fed held roughly $800 billion in assets before the financial crisis and $4.5 trillion now.”
The fact the Fed will not be SELLING Treasuries to reduce the balance sheet is why interest rates did not move up appreciably following the announcement.
However, for those that believe this is a “bulletproof” market, this announcement means a great deal.
As I have shown you previously, the Fed’s timing of the reinvestment of proceeds back into the market has acted as a “Stealth QE” to support asset prices against an economic or geopolitical shock.
[image]https://realinvestmentadvice.com/wp-content/uploads/2017/06/Fed-Balance-Sheet-061717.png[/image]
That activity has also acted to suppress volatility in the markets by providing the “Fed Put” to keep investors betting on the “long side.”
[image]https://realinvestmentadvice.com/wp-content/uploads/2017/06/VIX-061617.png[/image]
Axel Merk summed up well what happens when these things run in reverse:
“I have little doubt that a substantial driver of low volatility may be central banks. Low interest rates and quantitative easing (QE) compress risk premia; in plain English, this means not only that junk bonds trade at a lower premium over Treasuries, but that perceived risk is reduced in all markets, including equities, causing volatility to be lower.
When central bankers ‘do whatever it takes,’ it is no surprise that investors chase yield without being concerned about negative consequences.
But when central bankers ‘taper’ their purchases, odds are that volatility comes back as taper tantrums have shown.”
He is right, there is very little concern about the risk being taken on by investors currently without any regard for the underlying risk as they chase “yield and return.”
[image]https://realinvestmentadvice.com/wp-content/uploads/2017/06/SPX-HYG-061716.png[/image]
The forgotten piece of this “fairytale” is that RISK = How much you LOSE when you are wrong.
Currently, the risk/reward ratio is currently heavily skewed against investors in both the short, intermediate and long-term outlook.