Published
52 mins ago
on
March 28, 2025
| 15 views
-->
By
Jenna Ross
Graphics & Design
- Lebon Siu
The following content is sponsored by Terzo
Key Takeaways
- Inflation can drastically reduce the purchasing power of your money over time.
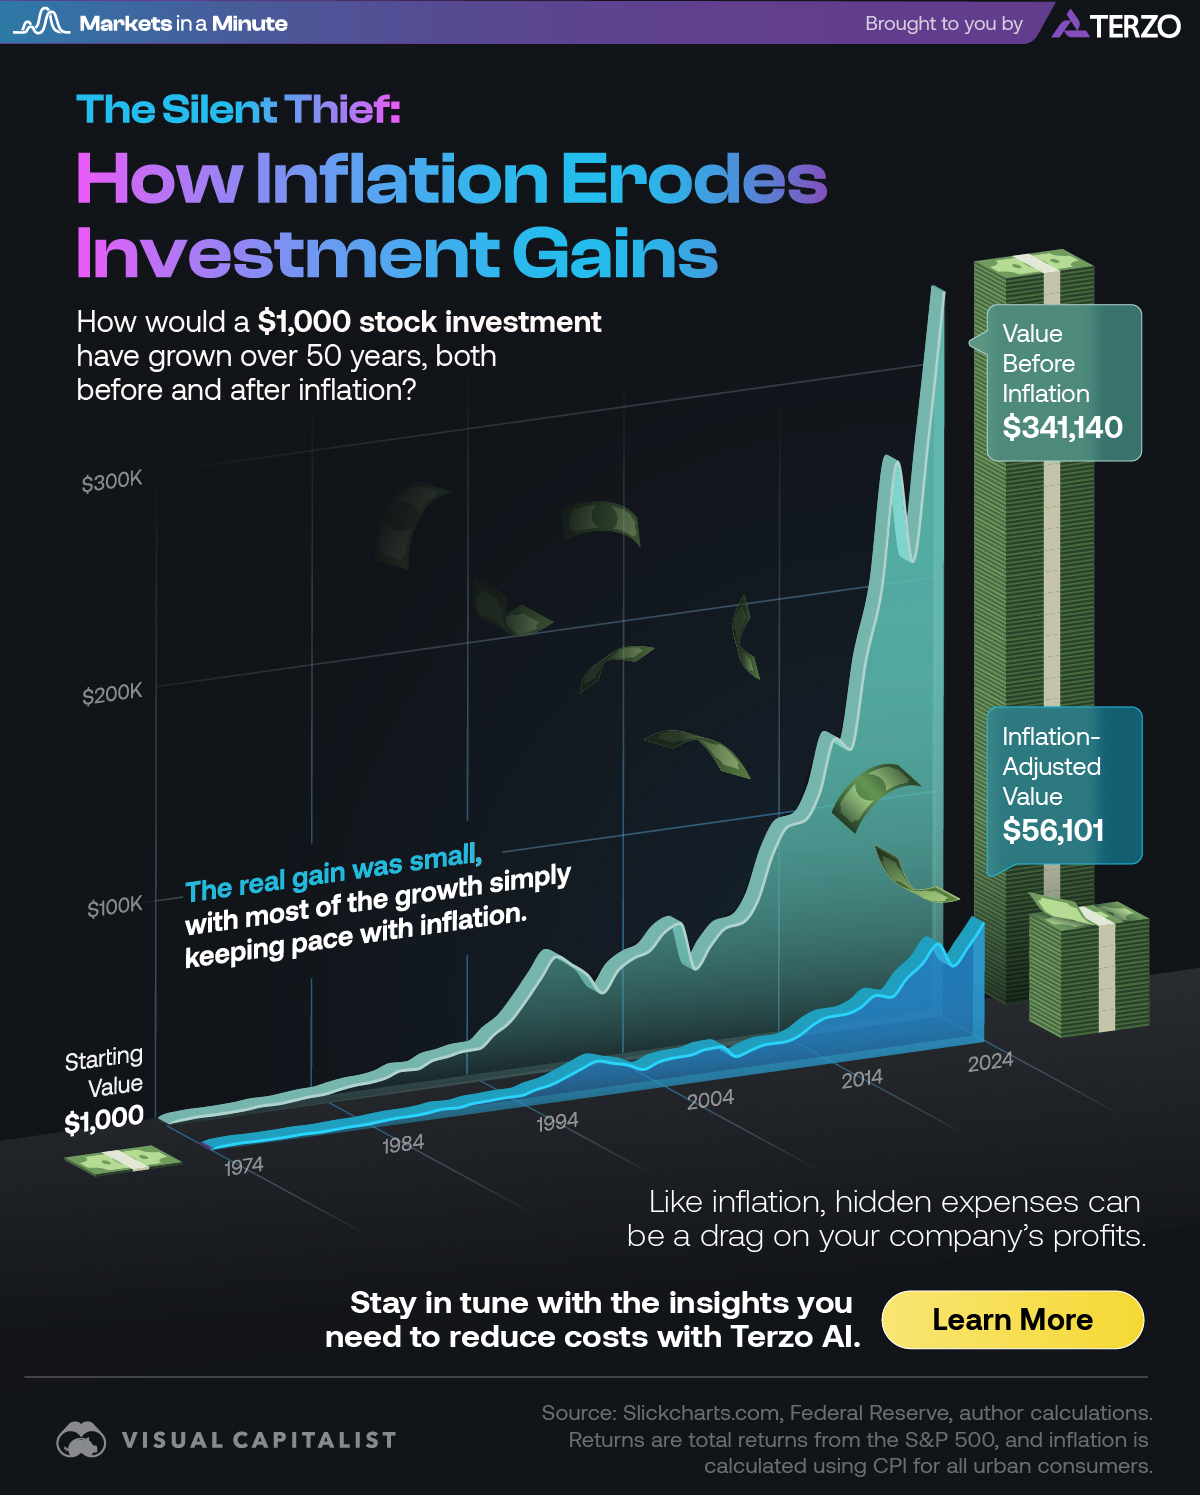
- A $1,000 investment in large-cap U.S. stocks held from 1974-2024 would be worth $341K before inflation and just $56K after adjusting for inflation.
How the Inflation Rate Erodes Investment Gains
Imagine there’s a thief that sneaks into your financial accounts. At first glance you don’t notice, because your account balance is the same. But when you go to spend the money, it buys you less of the things it used to. Your money doesn’t hold the same value anymore.
This is how the inflation rate can work against you. This graphic, in partnership with Terzo, shows how inflation can erode your investment value over time.
Investment Values Before and After Inflation
In our example, we assume someone invested $1,000 in large cap U.S. stocks at the end of 1974 and held it until the end of 2024.
The value before inflation is often referred to as the nominal value, and is the total dollar amount before any adjustments. The inflation-adjusted value shows how the inflation rate reduces the real return an investor would receive each year.
| Year | Value Before Inflation | Inflation-Adjusted Value |
|---|---|---|
| 1974 | $1,000 | $1,000 |
| 1975 | $1,372 | $1,283 |
| 1976 | $1,699 | $1,515 |
| 1977 | $1,577 | $1,318 |
| 1978 | $1,681 | $1,288 |
| 1979 | $1,990 | $1,347 |
| 1980 | $2,636 | $1,585 |
| 1981 | $2,506 | $1,384 |
| 1982 | $3,046 | $1,620 |
| 1983 | $3,734 | $1,913 |
| 1984 | $3,968 | $1,956 |
| 1985 | $5,227 | $2,482 |
| 1986 | $6,203 | $2,913 |
| 1987 | $6,528 | $2,936 |
| 1988 | $7,613 | $3,279 |
| 1989 | $10,025 | $4,126 |
| 1990 | $9,714 | $3,768 |
| 1991 | $12,674 | $4,770 |
| 1992 | $13,640 | $4,989 |
| 1993 | $15,015 | $5,345 |
| 1994 | $15,213 | $5,275 |
| 1995 | $20,930 | $7,077 |
| 1996 | $25,736 | $8,422 |
| 1997 | $34,321 | $11,044 |
| 1998 | $44,130 | $13,975 |
| 1999 | $53,415 | $16,474 |
| 2000 | $48,555 | $14,484 |
| 2001 | $42,781 | $12,567 |
| 2002 | $33,327 | $9,562 |
| 2003 | $42,885 | $12,078 |
| 2004 | $47,551 | $12,969 |
| 2005 | $49,885 | $13,156 |
| 2006 | $57,762 | $14,856 |
| 2007 | $60,934 | $15,057 |
| 2008 | $38,388 | $9,477 |
| 2009 | $48,546 | $11,668 |
| 2010 | $55,857 | $13,227 |
| 2011 | $57,035 | $13,117 |
| 2012 | $66,161 | $14,956 |
| 2013 | $87,590 | $19,507 |
| 2014 | $99,581 | $22,011 |
| 2015 | $100,956 | $22,153 |
| 2016 | $113,030 | $24,299 |
| 2017 | $137,704 | $28,992 |
| 2018 | $131,673 | $27,203 |
| 2019 | $173,137 | $34,968 |
| 2020 | $204,994 | $40,847 |
| 2021 | $263,848 | $49,116 |
| 2022 | $216,065 | $37,784 |
| 2023 | $272,868 | $46,171 |
| 2024 | $341,140 | $56,101 |
Values are at the end of the respective calendar year. Returns are total returns from the S&P 500, and U.S. inflation is calculated using CPI for all urban consumers. These calculations do not take any investment fees or taxes into account.
After 50 years, the $1,000 investment would be worth over $341,000 in unadjusted terms. However, once we take inflation into account, the investment is only worth $56,000 in real terms. This reflects the fact that the purchasing power of money can drop drastically over time as goods and services become more expensive.
You can also see how the gap between the two values widens over time. Inflation doesn’t just happen once; it keeps eating away at your money year after year. That’s compounding. Each year, the amount you lose to inflation gets added to the previous year’s loss, resulting in a bigger and bigger difference between your unadjusted returns and what your money can actually buy.
The Inflation Rate and Other Hidden Costs
Because inflation can have such a big impact on your spending power over time, it’s an important factor to consider when you’re selecting investments. For example, U.S. large cap stocks have historically generated returns that outpace inflation on average. On the other hand, certificates of deposit (CDs) and bonds are less likely to keep up with the inflation rate.
Inflation isn’t the only thief silently “stealing” your money. For example, many companies are losing money because of duplicate or redundant supplier spending.
![]()
Looking for insights to help you reduce company costs? Learn more about Terzo AI.
Related Topics: #investing #inflation #purchasing power #Terzo #real return
Click for Comments
var disqus_shortname = "visualcapitalist.disqus.com";
var disqus_title = "The Silent Thief: How Inflation Erodes Investment Gains";
var disqus_url = "https://www.visualcapitalist.com/sp/ter01-how-the-inflation-rate-erodes-investment-gains/";
var disqus_identifier = "visualcapitalist.disqus.com-176215";
You may also like
-
Stocks5 months ago
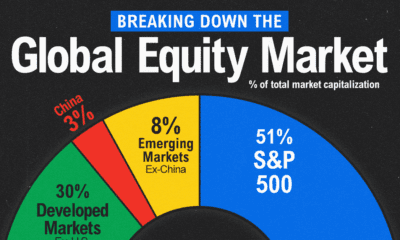
The S&P 500 Makes Up 51% of Global Stock Market Value
See a unique visual breakdown of the global equity market in this infographic.
-

Investor Education5 months ago
Visualizing S&P 500 Performance by Presidential Year
We visualized historical data since November 1980 to uncover average S&P 500 performance by presidential year.
-
Stocks5 months ago
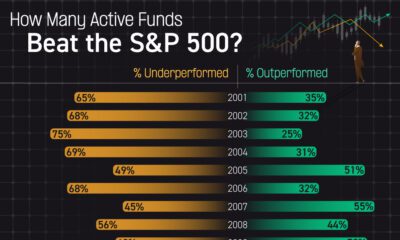
Infographic: How Many Active Funds Beat the S&P 500?
We visualized over 20 years of history to see how many active funds were able to beat the S&P 500.
-

Money1 year ago
The 20 Most Common Investing Mistakes, in One Chart
Here are the most common investing mistakes to avoid, from emotionally-driven investing to paying too much in fees.
-

Stocks2 years ago
Visualizing BlackRock’s Top Equity Holdings
BlackRock is the world’s largest asset manager, with over $9 trillion in holdings. Here are the company’s top equity holdings.
-

Investor Education2 years ago
10-Year Annualized Forecasts for Major Asset Classes
This infographic visualizes 10-year annualized forecasts for both equities and fixed income using data from Vanguard.
Subscribe
Please enable JavaScript in your browser to complete this form.Join the 375,000+ subscribers who receive our daily email *Sign Up
The post The Silent Thief: How Inflation Erodes Investment Gains appeared first on Visual Capitalist.