Published
20 minutes ago
on
December 15, 2025
| 337 views
-->
By
Cody Good
Graphics & Design
- Harrison Schell
The following content is sponsored by Lloyd's Register Foundation
View the full-size version of this graphic
Special Report: 8,500 Toxic Shipwrecks. Zero Global Framework.
Key Takeaways
- Over 8,500 historic shipwrecks worldwide pose a toxic threat, containing millions of metric tons of oil and other hazardous materials.
- Small island states are especially at risk, lacking the resources to monitor or respond to leaks in their waters.
- The Malta Manifesto urges coordinated global action to identify and mitigate high-risk shipwrecks.
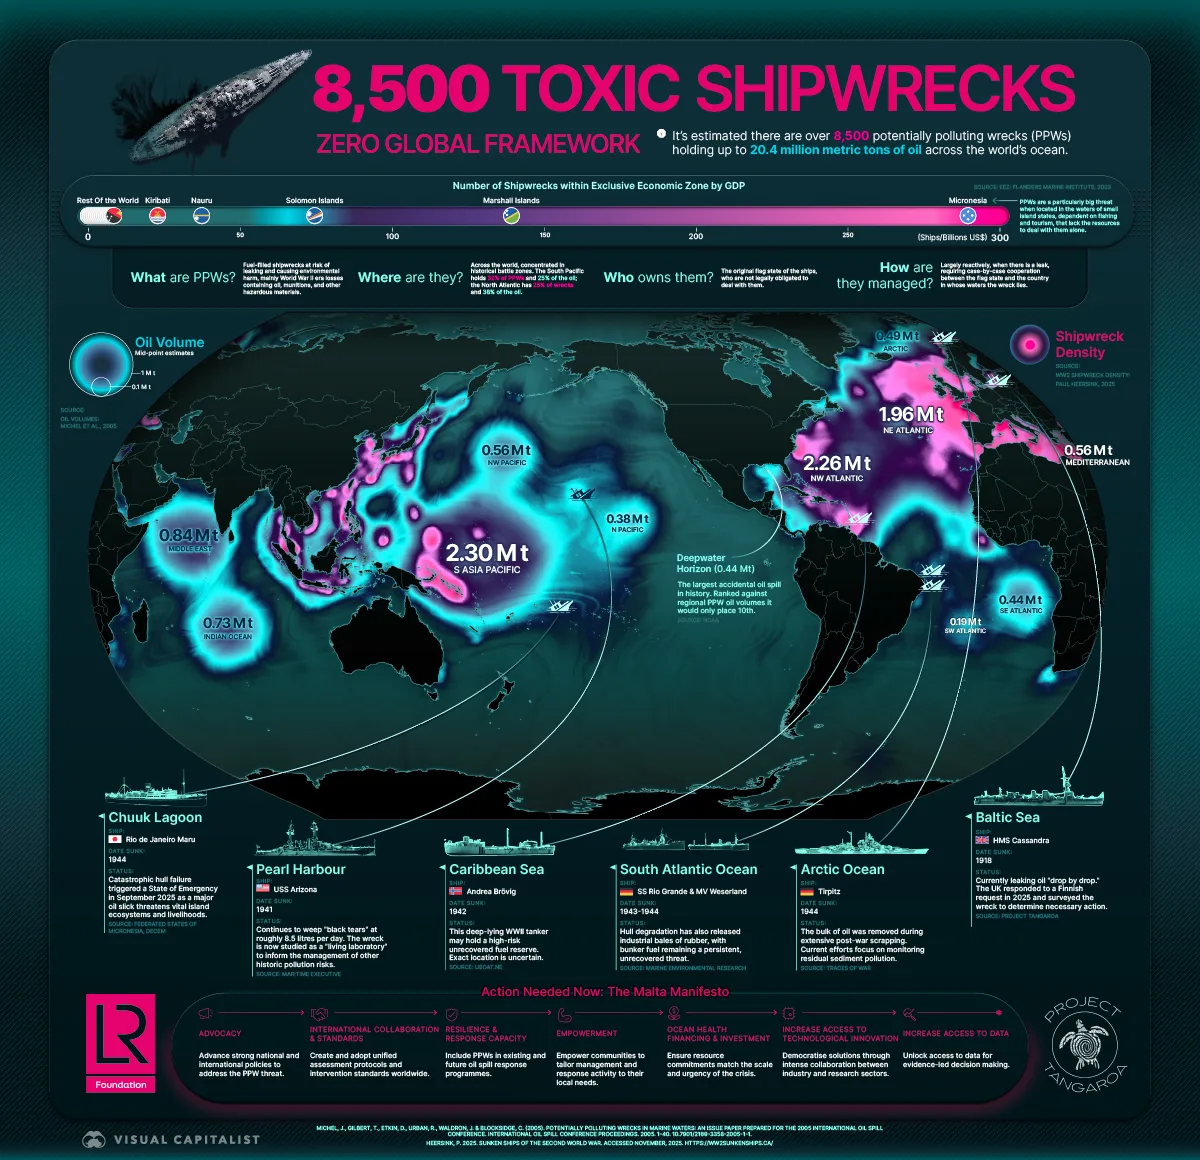
There are over 8,500 potentially polluting wrecks (PPWs) across the world’s ocean. These shipwrecks may hold as much as 20.4 million metric tons of oil and toxic substances, according to estimates.
This graphic, in partnership with Lloyd’s Register Foundation, shows the global density of World War II wrecks. It uses data from Paul Heersink’s Sunken Ships of the Second World War database and oil estimates from Michel et al., 2005, presented at the International Oil Spill Conference.
Where Toxic Shipwrecks Are Found
World War II battles sank over 75% of PPWs, concentrating most in regions such as the South Pacific (32% of PPWs, 25% of oil) and the North Atlantic (25% of PPWs, 38% of oil).
Here is a table that shows the concentration of PPWs by ocean region and their estimated oil content:
| Ocean Region | Number of Shipwrecks | Oil Volume, Mid-Point Estimate (metric tons) |
|---|---|---|
| South Asian-Pacific | 2,737 | 2,305,000 |
| Northwest Atlantic | 1,393 | 2,256,000 |
| Northewest Pacific | 1,152 | 568,500 |
| Northeast Atlantic | 786 | 1,969,500 |
| Scandinavian-West Russian Arctic | 398 | 493,000 |
| Mediterranean Sea | 361 | 566,000 |
| North Pacific | 329 | 379,000 |
| Indian | 296 | 730,000 |
| Middle-Eastern Gulfs | 193 | 846,500 |
| Southwest Atlantic | 160 | 194,500 |
| Southeast Atlantic | 74 | 441,500 |
| Canadian Artic | 13 | 7,900 |
| East Russian Arctic | 13 | 4,800 |
| Southeast Pacific | 12 | 48,500 |
| Antarctic-Southwest Atlantic | 1 | 108,500 |
| Anarctic-Indian | 1 | 26,450 |
| Antarctic-Southeast Pacific | 1 | 475 |
Source: Michel et. al., 2005
These wrecks remain under the ownership of the original flag states, who have no legal obligation to intervene. As a result, proactive international cooperation is urgently required.
The Environmental Threat
Many PPWs lie in the waters of small island states reliant on fishing and tourism. Even minor oil spills in sensitive marine areas can be devastating.
Here is a table showing the top 10 countries with the most PPWs located in their exclusive economic zones (EEZs), ranked by GDP:
| Country | Ships within EEZ by GDP (Billions US$) |
|---|---|
| Micronesia | 288.49 |
| Marshall Islands | 139.11 |
| Solomon Islands | 74.40 |
| Nauru | 37.42 |
| Kiribati | 22.74 |
| Papua New Guinea | 8.11 |
| Vanuatu | 6.89 |
| Cape Verde | 6.87 |
| Sierra Leone | 5.56 |
| Liberia | 4.63 |
Source: Shipwreck locations – Paul Heersink, 2025; EEZ file – Flanders Marine Institute, 2023
Because these nations often lack the resources to respond, they remain especially vulnerable to emerging threats.
The Malta Manifesto: Charting a Path Forward
The Malta Manifesto, launched by Project Tangaroa, calls for a global framework to address the PPW threat. It outlines key actions, from identifying high-risk wrecks to supporting coastal nations with limited capacity.
By recognizing that even a single leak in the wrong location can have far-reaching impacts, the Manifesto pushes for equitable, science-based solutions to this overlooked legacy of conflict.
![]()
Read the Malta Manifesto.
More from Lloyd's Register Foundation
-
Environment1 year ago
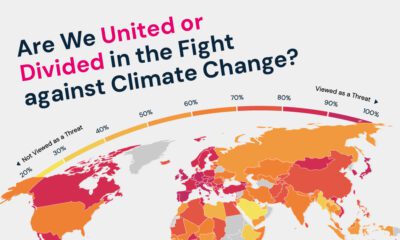
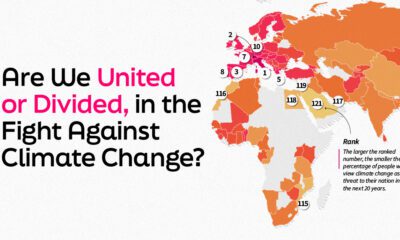
Are We United or Divided in The Fight Against Climate Change?
Visual Capitalist partnered with Lloyd’s Register Foundation to determine which nations believe climate change is a threat.
-
Business1 year ago
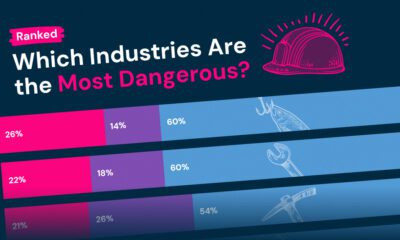
Ranked: Which Industries Are the Most Dangerous?
In this graphic, Visual Capitalist partnered with Lloyd’s Register Foundation to analyze workplace safety and determine the most dangerous industry.
-
Environment1 year ago
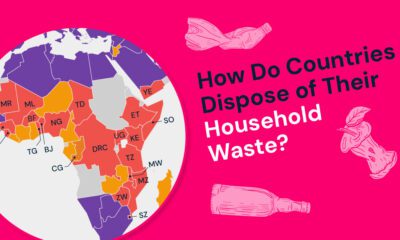
Visualized: How Do Countries Dispose of Their Household Waste?
In this graphic, Visual Capitalist has partnered with Lloyd’s Register Foundation to explore the most common household waste disposal practices in 142 countries.
-

Money1 year ago
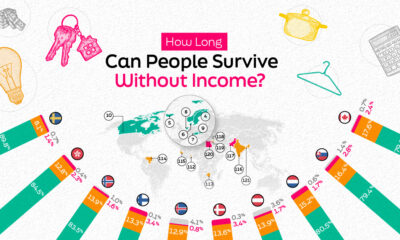
Visualized: How Long Can Each Generation Survive Without Income?
Visual Capitalist has partnered with Lloyd’s Register Foundation to explore how long each generation can cover their needs without income.
-
Green2 years ago
World Risk Poll: How Do People Feel About Climate Change?
This graphic explores 121 nations thoughts on climate change and ranks them by the volume of their population who views it as a threat.
-
Economy2 years ago
World Risk Poll: How Long Can People Survive Without Income?
Income security is critical in resilience. In this graphic, we explore how secure people are and how long they could live without income.
-
Misc2 years ago
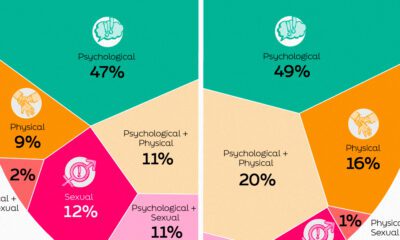
World Risk Poll: Visualizing Harassment and Violence in the Workplace
This infographic shows the types of workplace violence and harassment faced by people in the global workplace.
-
Technology2 years ago
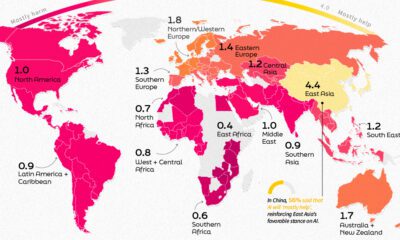
World Risk Poll: Mapping Global Sentiment on AI
This infographic shows public perception of AI all over the globe and how this sentiment is affected by where you live.
Subscribe
Please enable JavaScript in your browser to complete this form.Join 375,000+ email subscribers: *Sign Up