Published
24 mins ago
on
May 16, 2025
| 44 views
-->
By
Julia Wendling
Graphics & Design
- Amy Realey
The following content is sponsored by Tema ETFs
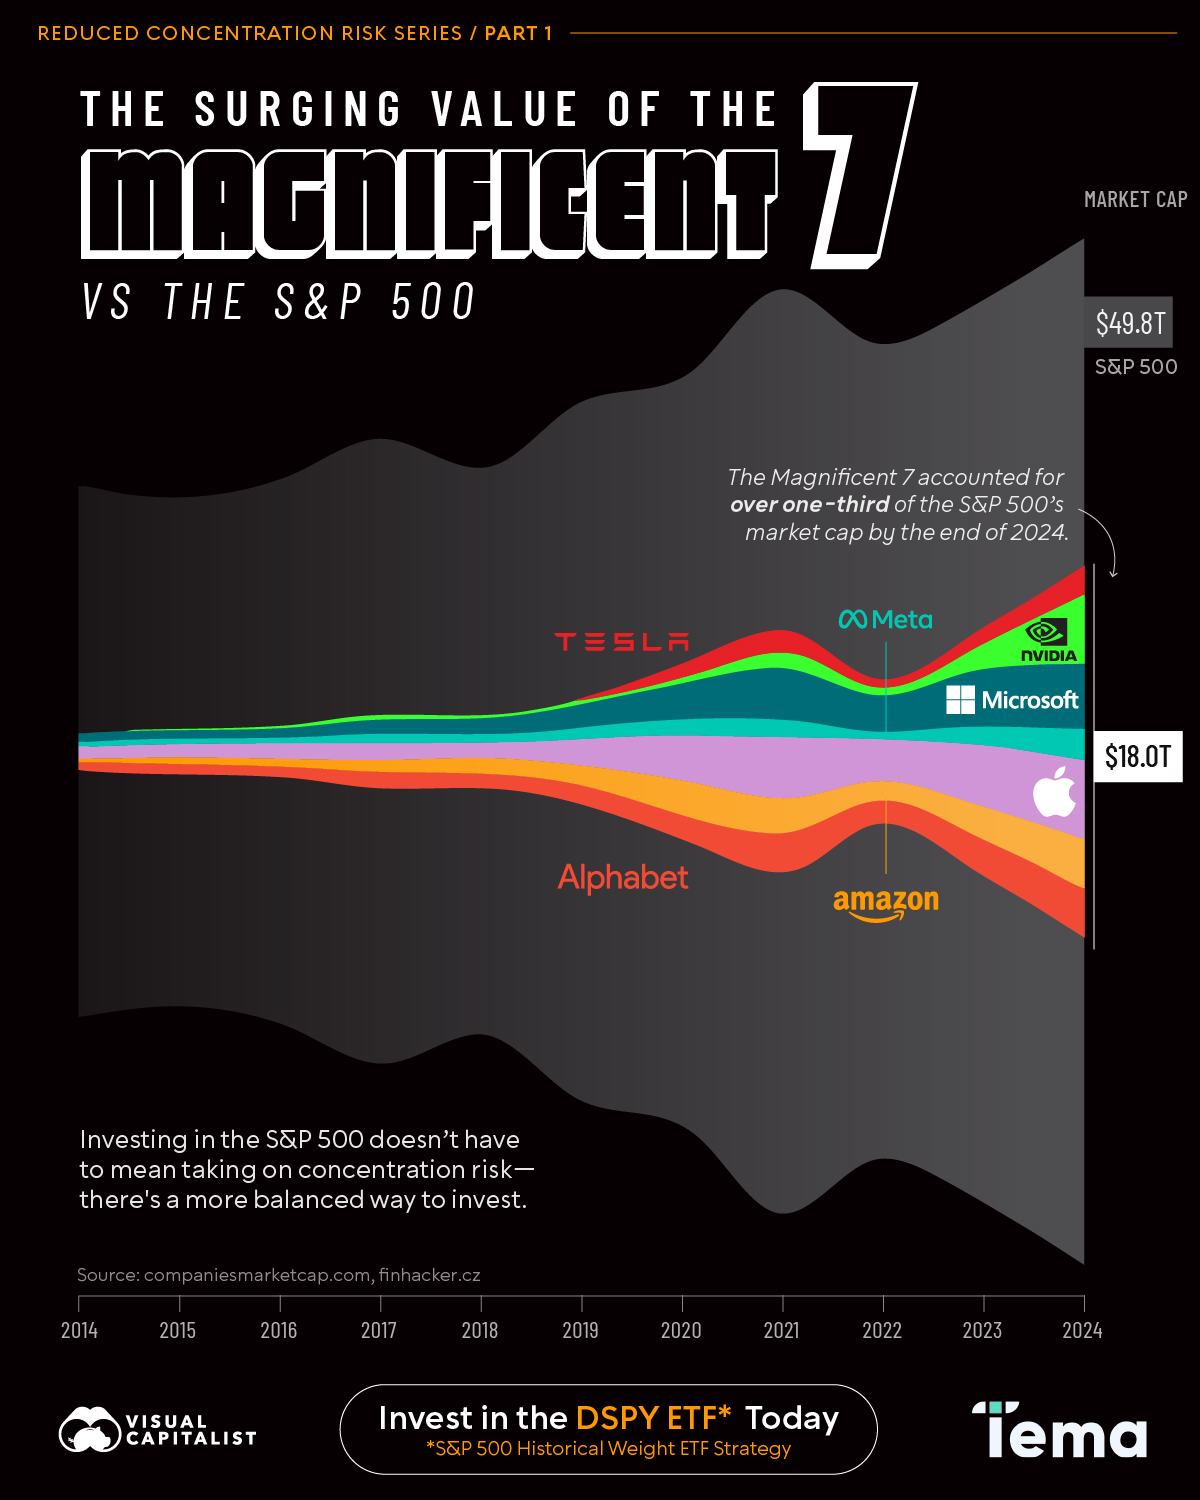
Surging Value of the Magnificent 7 vs. the S&P 500 (2014-2024)
The Magnificent 7 stocks have soared from $1.8 trillion in 2014 to over $18 trillion in market capitalization by 2024—but is their growing dominance making the S&P 500 concentrated?
This visualization, created in partnership with Tema ETFs, provides visual context to the surging value of the Magnificent 7 stocks as a share of the S&P 500.
A Decade of S&P 500 Growth
The S&P 500 has seen remarkable growth over the past decade. In 2014, the index’s total market capitalization stood at just over $18 trillion—by the end of 2024, it had soared to nearly $50 trillion.
This surge in market value was mirrored in performance: from the start of 2014 to the end of 2024, the index delivered a total return of more than 220%.
A Decade of Magnificent 7 Growth
One group of stocks has stood out with exceptional performance: the “Magnificent 7.” This group is made up of Alphabet (Google), Amazon, Apple, Meta, Microsoft, Nvidia, and Tesla.
Here is the evolution of each company’s market capitalization from 2014-2024:
| Year | GOOG | AMZN | AAPL | META | MSFT | NVDA | TSLA | Mag. 7 | S&P 500 |
|---|---|---|---|---|---|---|---|---|---|
| 2024 | 2,365 | 2,352 | 3,863 | 1,514 | 3,200 | 3,355 | 1,385 | 18,034 | 49,810 |
| 2023 | 1,756 | 1,570 | 2,994 | 910 | 2,794 | 1,223 | 790 | 12,037 | 40,040 |
| 2022 | 1,145 | 857 | 2,066 | 320 | 1,787 | 364 | 389 | 6,928 | 32,130 |
| 2021 | 1,917 | 1,691 | 2,901 | 922 | 2,522 | 735 | 1,061 | 11,749 | 40,360 |
| 2020 | 1,185 | 1,634 | 2,255 | 778 | 1,681 | 323 | 669 | 8,525 | 31,660 |
| 2019 | 921 | 920 | 1,287 | 585 | 1,200 | 144 | 76 | 5,133 | 26,760 |
| 2018 | 724 | 737 | 746 | 374 | 780 | 81 | 57 | 3,500 | 21,030 |
| 2017 | 729 | 564 | 861 | 513 | 660 | 117 | 52 | 3,496 | 22,820 |
| 2016 | 539 | 356 | 609 | 332 | 483 | 58 | 34 | 2,411 | 19,270 |
| 2015 | 528 | 318 | 584 | 297 | 440 | 18 | 32 | 2,216 | 17,900 |
| 2014 | 360 | 144 | 643 | 217 | 382 | 11 | 28 | 1,784 | 18,250 |
This explosive growth has had a profound effect on the broader market. These tech-heavy giants now make up over one-third of the S&P 500. This has raised concerns about concentration risk within portfolios—which occurs when a handful of companies hold an outsized influence over index performance.
The Same Index; Less Concentrated
Investing in America’s top 500 companies doesn’t have to mean accepting concentration risk. There’s a more balanced approach for investors who want exposure to leading U.S. businesses without over-relying on a few dominant stocks.
The Tema S&P 500 Historical Weight ETF (DSPY) mirrors the S&P 500 while adjusting company weights to reflect their 35-year historical average levels. This strategy aims to reduce today’s high concentration risk and provide investors with a more balanced approach to investing in the S&P 500.
Disclosure
Carefully consider the Fund’s investment objectives, risk factors, charges and expenses before investing. This and additional information can be found in the Fund’s prospectus or summary prospectus, which may be obtained by visiting temaetfs.com.
Read the prospectus carefully before investing.
Risk Information
Investing involves risk including possible loss of principal. There is no guarantee the adviser’s investment strategy will be successful.
Sector Focus Risk: The Fund may invest a significant portion of its assets in one or more sectors, including Industrials, Materials and Utilities, and thus will be more susceptible to the risks affecting those sectors than funds that have more diversified holdings across several sectors. The success of the Fund’s investment strategy depends in part on the ability of the companies in which it invests to reshore or onshore services to the United States.
Companies may face significant legal, financial and political headwinds in the reshoring or onshoring of jobs into the United States, and these factors may be detrimental to performance. Industrial and Utilities sector companies will likewise be subject to the risks of Government regulation, world events, exchange rates and economic conditions, technological developments and liabilities for environmental damage and general civil liabilities. In addition, many materials companies are significantly affected by the level and volatility of commodity prices, exchange rates, import controls, worldwide competition, environmental policies and consumer demand. Investing in foreign and emerging markets involves risks relating to political, economic, or regulatory conditions not associated with investments in U.S. securities and instruments in addition the fund Is exposed to currency risk.
Tema ETFs LLC serves as the investment adviser to Tema American Reshoring ETF (the “Fund”), and NEOS Investments, LLC serves as a sub adviser to the Fund. The Fund is distributed by Foreside Services LLC, which is not affiliated with Tema ETFs LLC nor NEOS Investments, LLC. Check the background of Foreside on FINRA’s BrokerCheck.
Distributor: Foreside Fund Service LLC For inquiries: [email protected]
Related Topics: #apple #google #investing #tesla #amazon #s&p 500 #stocks #microsoft #nvidia #concentration #magnificent 7 #tema
Click for Comments
var disqus_shortname = "visualcapitalist.disqus.com";
var disqus_title = "The Surging Value of the Magnificent 7 Versus the S&P 500 (2014-2024)";
var disqus_url = "https://www.visualcapitalist.com/sp/magnificent-7-versus-sp-500-tema01/";
var disqus_identifier = "visualcapitalist.disqus.com-177575";
More from Tema ETFs
-

Markets24 mins ago
Visualized: S&P 500 Concentration Is at a 50-Year High
Subscribe
Please enable JavaScript in your browser to complete this form.Join the 375,000+ subscribers who receive our daily email *Sign Up