![]()
See more visualizations like this on the Voronoi app.
Use This Visualization
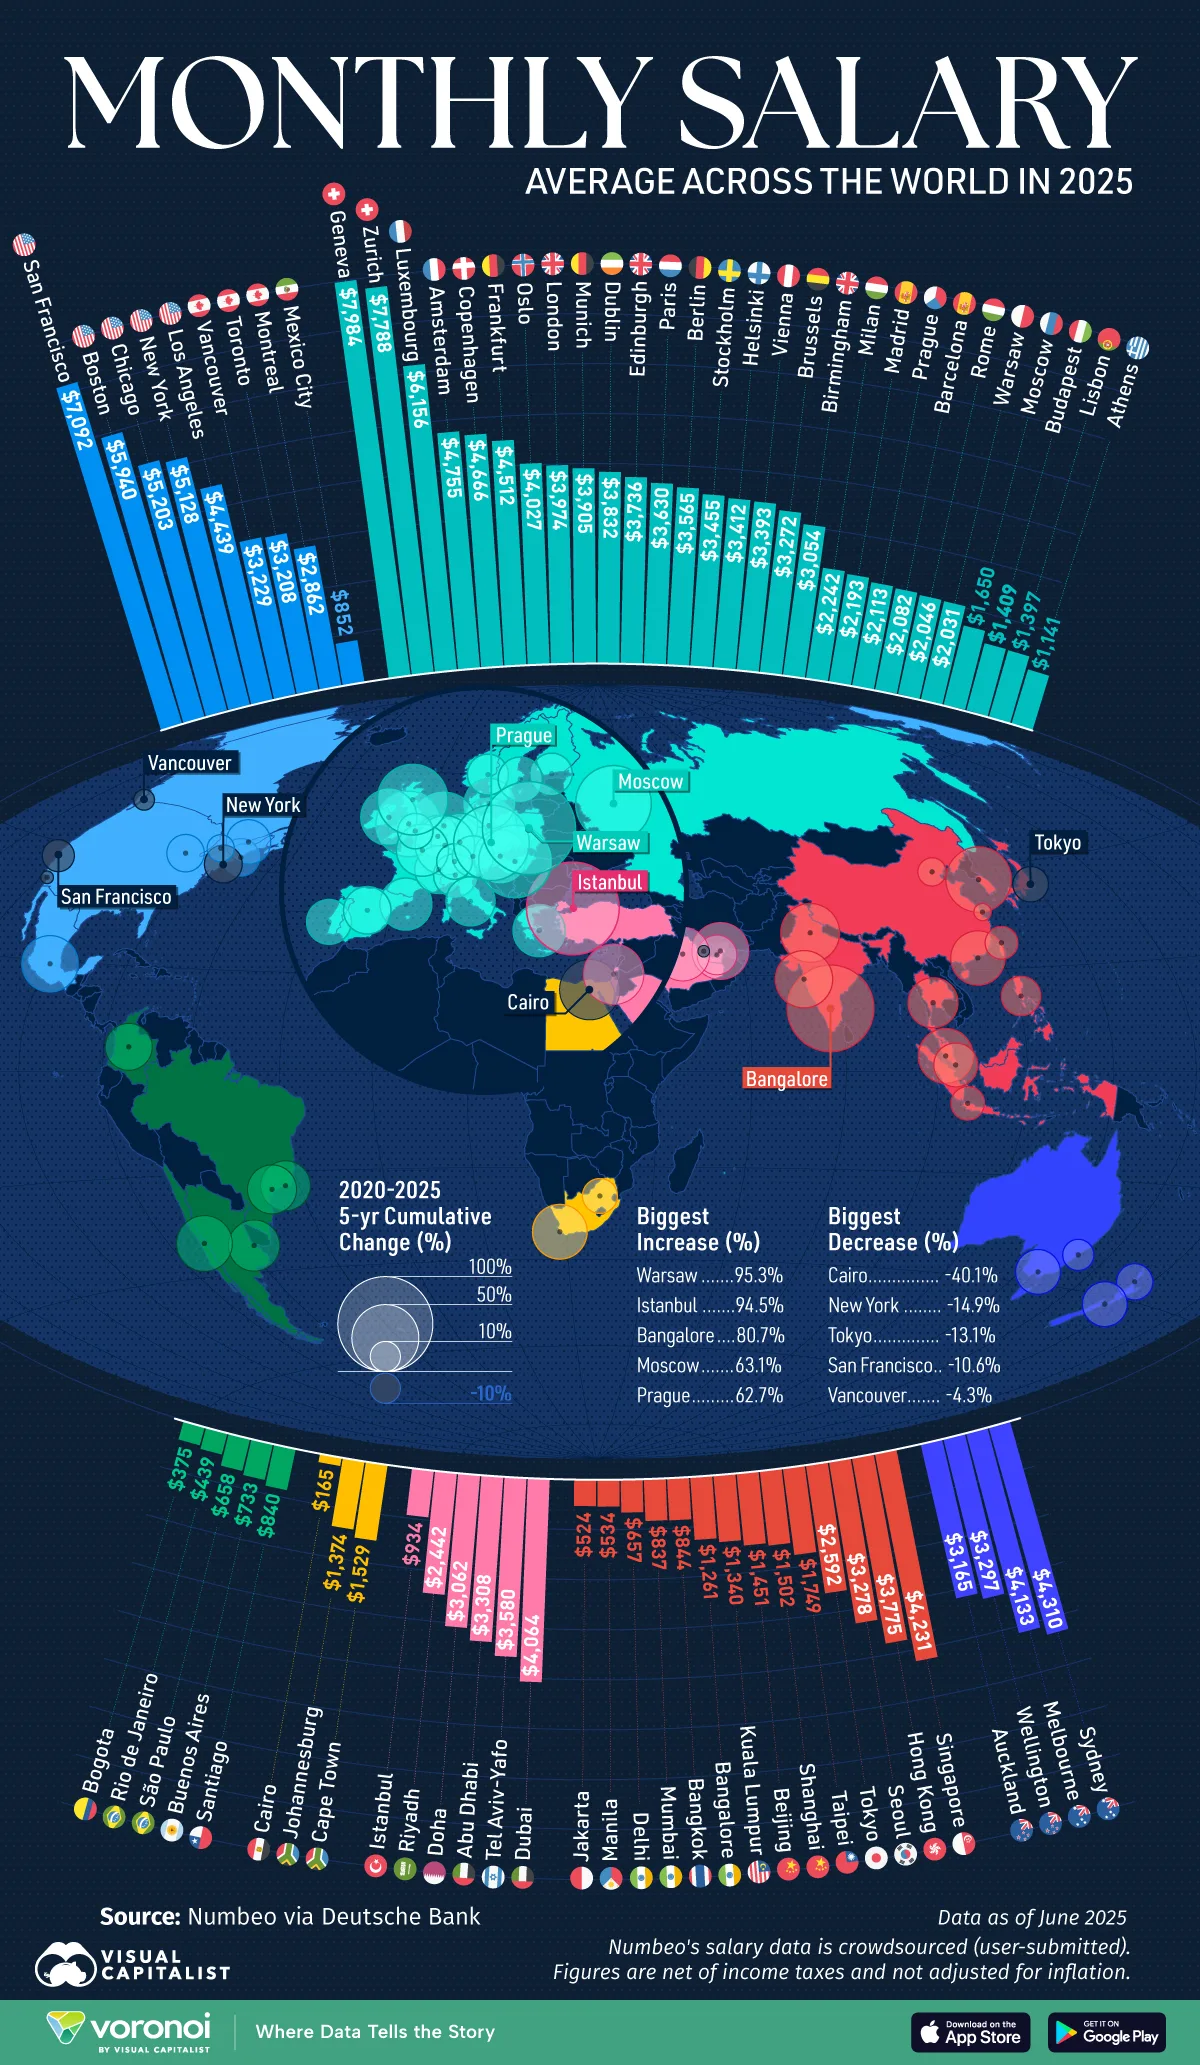
Visualized: Average Monthly Salary in Major Global Cities
See visuals like this from many other data creators on our Voronoi app. Download it for free on iOS or Android and discover incredible data-driven charts from a variety of trusted sources.
Average pay can look wildly different depending on where you live in the world—and it’s not just about job titles.
This visualization compares average monthly salaries across 69 major cities worldwide in 2025, and maps out the five-year cumulative changes since 2020, using data from Numbeo via Deutsche Bank.
Data & Discussion
A key note on methodology: Numbeo’s underlying inputs are primarily crowdsourced, with a smaller share (<10%) collected manually. That means the results can reflect who is reporting and when—especially in cities with fast-changing labor markets.
The data table below shows the average monthly salary in U.S. dollars for major global cities in 2020 and 2025 net of income taxes, along with the five-year cumulative change:
[table id=6677 /]
The 2020 salary values are nominal and not adjusted for inflation, so “growth” here reflects raw USD-denominated change rather than real purchasing-power gains, also affected by local currency value changes against the U.S. dollar.
Cities with the Highest and Lowest Salaries in the World
In 2025, the top of the list is led by Switzerland: Geneva ($7,984) and Zurich ($7,788) take the top two spots. San Francisco follows at $7,092, making it the highest-paying U.S. city in the dataset despite its five-year decline of 10.6%.
A second tier of high earners includes Luxembourg ($6,156) and Boston ($5,940), while Chicago ($5,203) and New York ($5,128) also land in the global top 10.
These cities tend to combine high-value industries (finance, tech, professional services) with tight labor markets and high costs of living—conditions that generally push nominal wages upward.
At the other end, several large emerging-market cities remain below $1,000/month in U.S. dollar terms in 2025, including Cairo ($165), Bogotá ($375), and Rio de Janeiro ($439), highlighting how wide the global wage gap remains even among major metros.
How Global Average Salaries Have Changed Since 2020
Across the 69 cities, only seven show a decline from 2020 to 2025—yet the drops are significant. Cairo has the steepest fall (-40.1%), while Tokyo (-13.1%) also declines despite Japan’s status as a high-income economy.
One reason is currency translation: since values are converted to U.S. dollars, a weakening local currency can make salaries look smaller even if local pay rose. Over the past five years since 2020, the Egyptian Pound has fallen 66% against the U.S. dollar, while the Japanese yen has fallen 30%.
New York stands out with a -14.9% change (from $6,023 in 2020 to $5,128 in 2025), the largest dollar decline among the cities shown. San Francisco also posted a significant decline of $839, falling 10.6% since 2020.
Some of this could be methodological noise (crowdsourced reporting can shift with respondent mix). But it could also reflect real labor-market dynamics after the pandemic—like more high earners working remotely, relocating, or seeing compensation shift from base pay into bonuses and equity that aren’t consistently captured in “salary” snapshots.
Global Cities with the Largest Salary Increases Since 2020
On the upside, several cities nearly doubled in U.S. dollar terms over five years. Warsaw posts the largest increase (+95.3%), followed by Istanbul (+94.5%) and Bangalore (+80.7%).
Notably, these jumps start from much lower 2020 bases—so large percentage gains don’t necessarily translate into top-tier pay levels in 2025.
Meanwhile, some of the biggest absolute dollar increases show up in already-high-paying European centers, with Luxembourg rising by $1,721 over the period (from $4,435 to $6,156) and Geneva climbing $1,608 (from $6,376 to $7,984).
Together, these patterns hint at a two-speed world: rich global hubs where already-high wages keep climbing, and fast-growing cities where percentage gains are large but catching up still takes time.
Learn More on the Voronoi App ![]()
To learn more about where salaries are the highest in the world on a purchasing power parity basis, check out this graphic on Voronoi.