![]()
See more visuals like this on the Voronoi app.
Use This Visualization
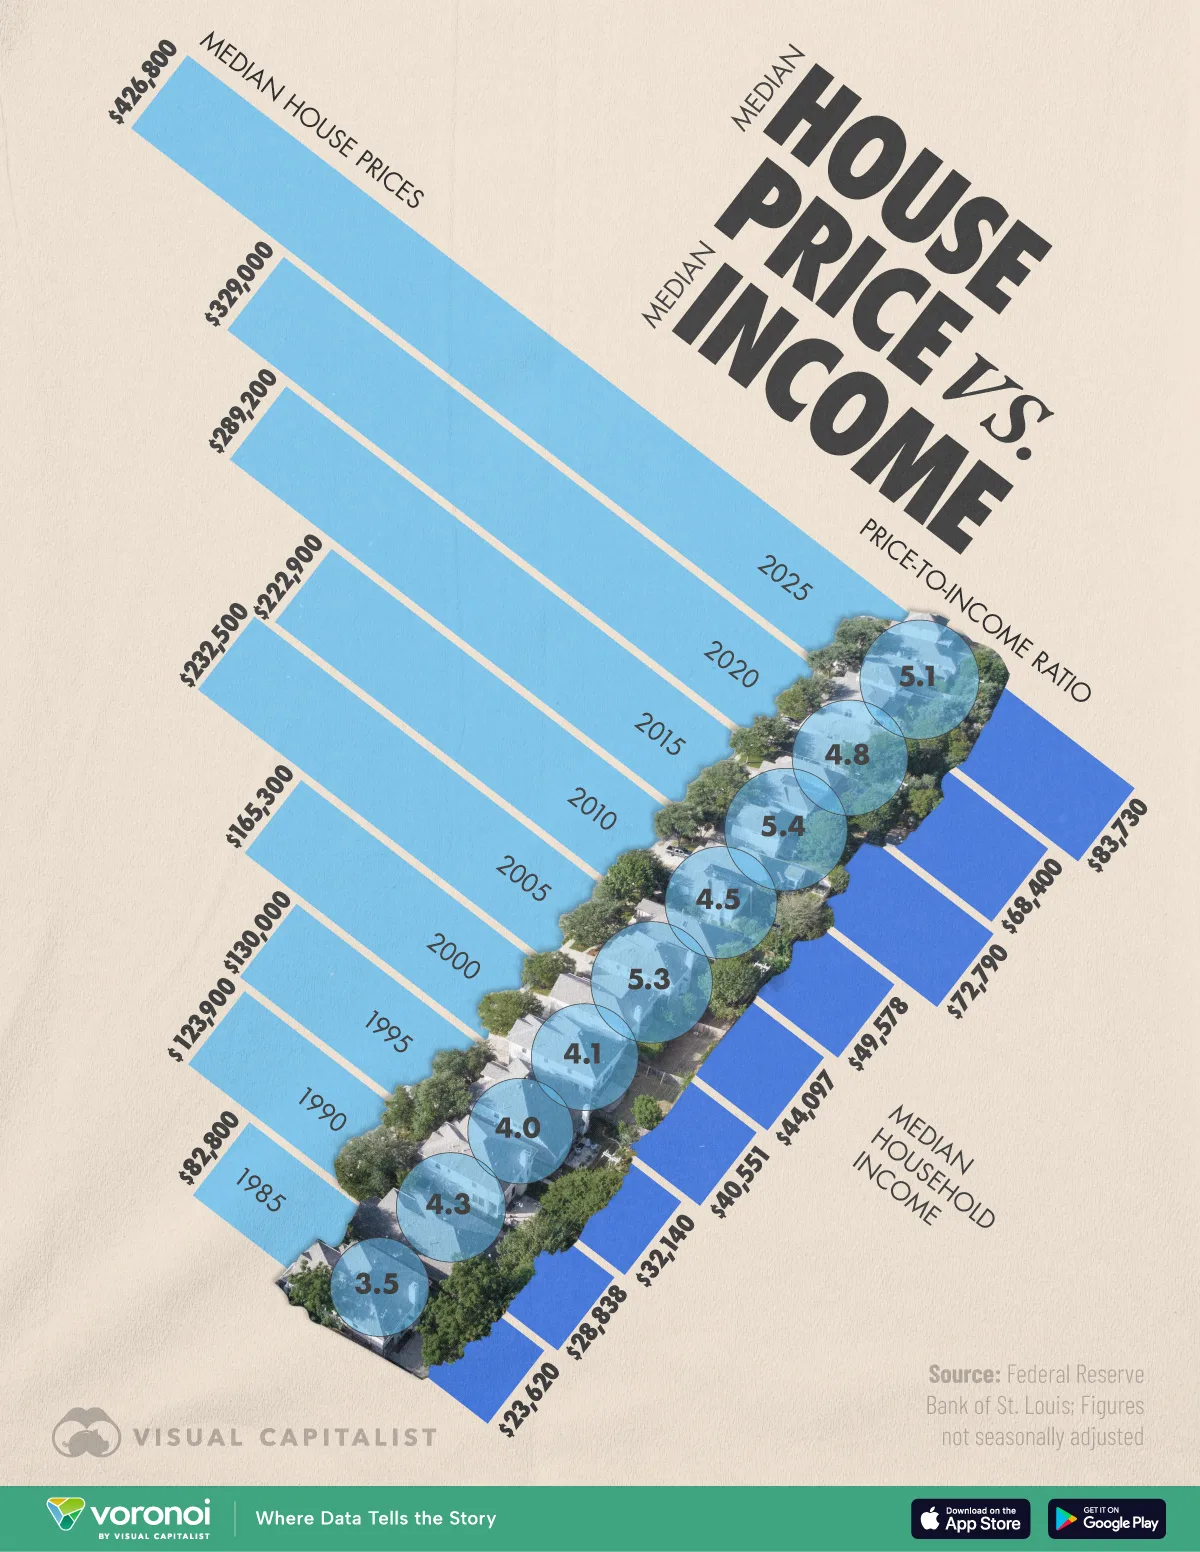
Why Homes Feel Pricier: U.S. House Prices vs. Income, 1985–2025
See visuals like this from many other data creators on our Voronoi app. Download it for free on iOS or Android and discover incredible data-driven charts from a variety of trusted sources.
Key Takeaways
- Since 1985, U.S. median household income rose roughly 255% while median house prices surged more than 415%.
- The widening gap helps explain why affordability challenges remain even during periods of income growth.
This infographic compares the growth of U.S. household income against median house prices over nearly four decades. While incomes have steadily climbed, housing costs have accelerated at a much faster pace. This creates a growing disconnect between what households earn and what homes cost. The result is a long-term shift in affordability that affects buyers across income levels.
The data for this visualization comes from FRED and Motio Research. It tracks nominal median household income alongside the median sales price of U.S. homes from 1985 to 2025.
The Early Years: A Manageable Gap
In 1985, the median home cost around $82,800 while the median household earned $23,620. That meant a home was roughly 3.5 times annual income. By 1990, home prices had risen faster than incomes but still remained within a range accessible to many middle-class buyers.
Analyzing the entire period, America’s price-to-income ratio swung from a modest 3.5 to peaks above 5.0, reflecting housing costs rising significantly faster than household incomes over time.
| Year | Household Income | Median House Prices | Price-to-Income Ratio |
|---|---|---|---|
| 1985 | $23,620 | $82,800 | 3.5 |
| 1990 | $28,838 | $123,900 | 4.3 |
| 1995 | $32,140 | $130,000 | 4.0 |
| 2000 | $40,551 | $165,300 | 4.1 |
| 2005 | $44,097 | $232,500 | 5.3 |
| 2010 | $49,578 | $222,900 | 4.5 |
| 2015 | $53,600 | $289,200 | 5.4 |
| 2020 | $68,400 | $329,000 | 4.8 |
| 2025 | $83,730 | $426,800 | 5.1 |
The 2000s Housing Boom and Its Aftermath
By 2005, home prices jumped to $232,500, more than five times median household income. After the 2008 crisis, prices briefly dipped, but incomes did not rise quickly enough to close the gap.
The Pandemic Era: A Surge in Prices
From 2020 to 2024, the affordability gap widened significantly. While median income grew from $68,400 to $83,730, home prices climbed from $329,000 to $426,800. Low interest rates, remote work, and supply shortages accelerated demand during the pandemic. Even as rates later rose, high prices remained sticky.
The gap between American home prices and incomes is especially worse in coastal U.S. cities. Notably, the median home price in LA is 12.5 times the median annual household income. This ratio stands at 10.5 in San Jose and 9.8 in New York on the East Coast.
Learn More on the Voronoi App ![]()
If you enjoyed today’s post, check out The United States of Unemployment on Voronoi, the new app from Visual Capitalist.