Visualized: EV Market Share in the U.S.
Electric vehicles are a fast growing segment in the U.S., but how much market share have they taken from traditional gasoline cars?
According to recent data from the U.S. Department of Energy, not much.
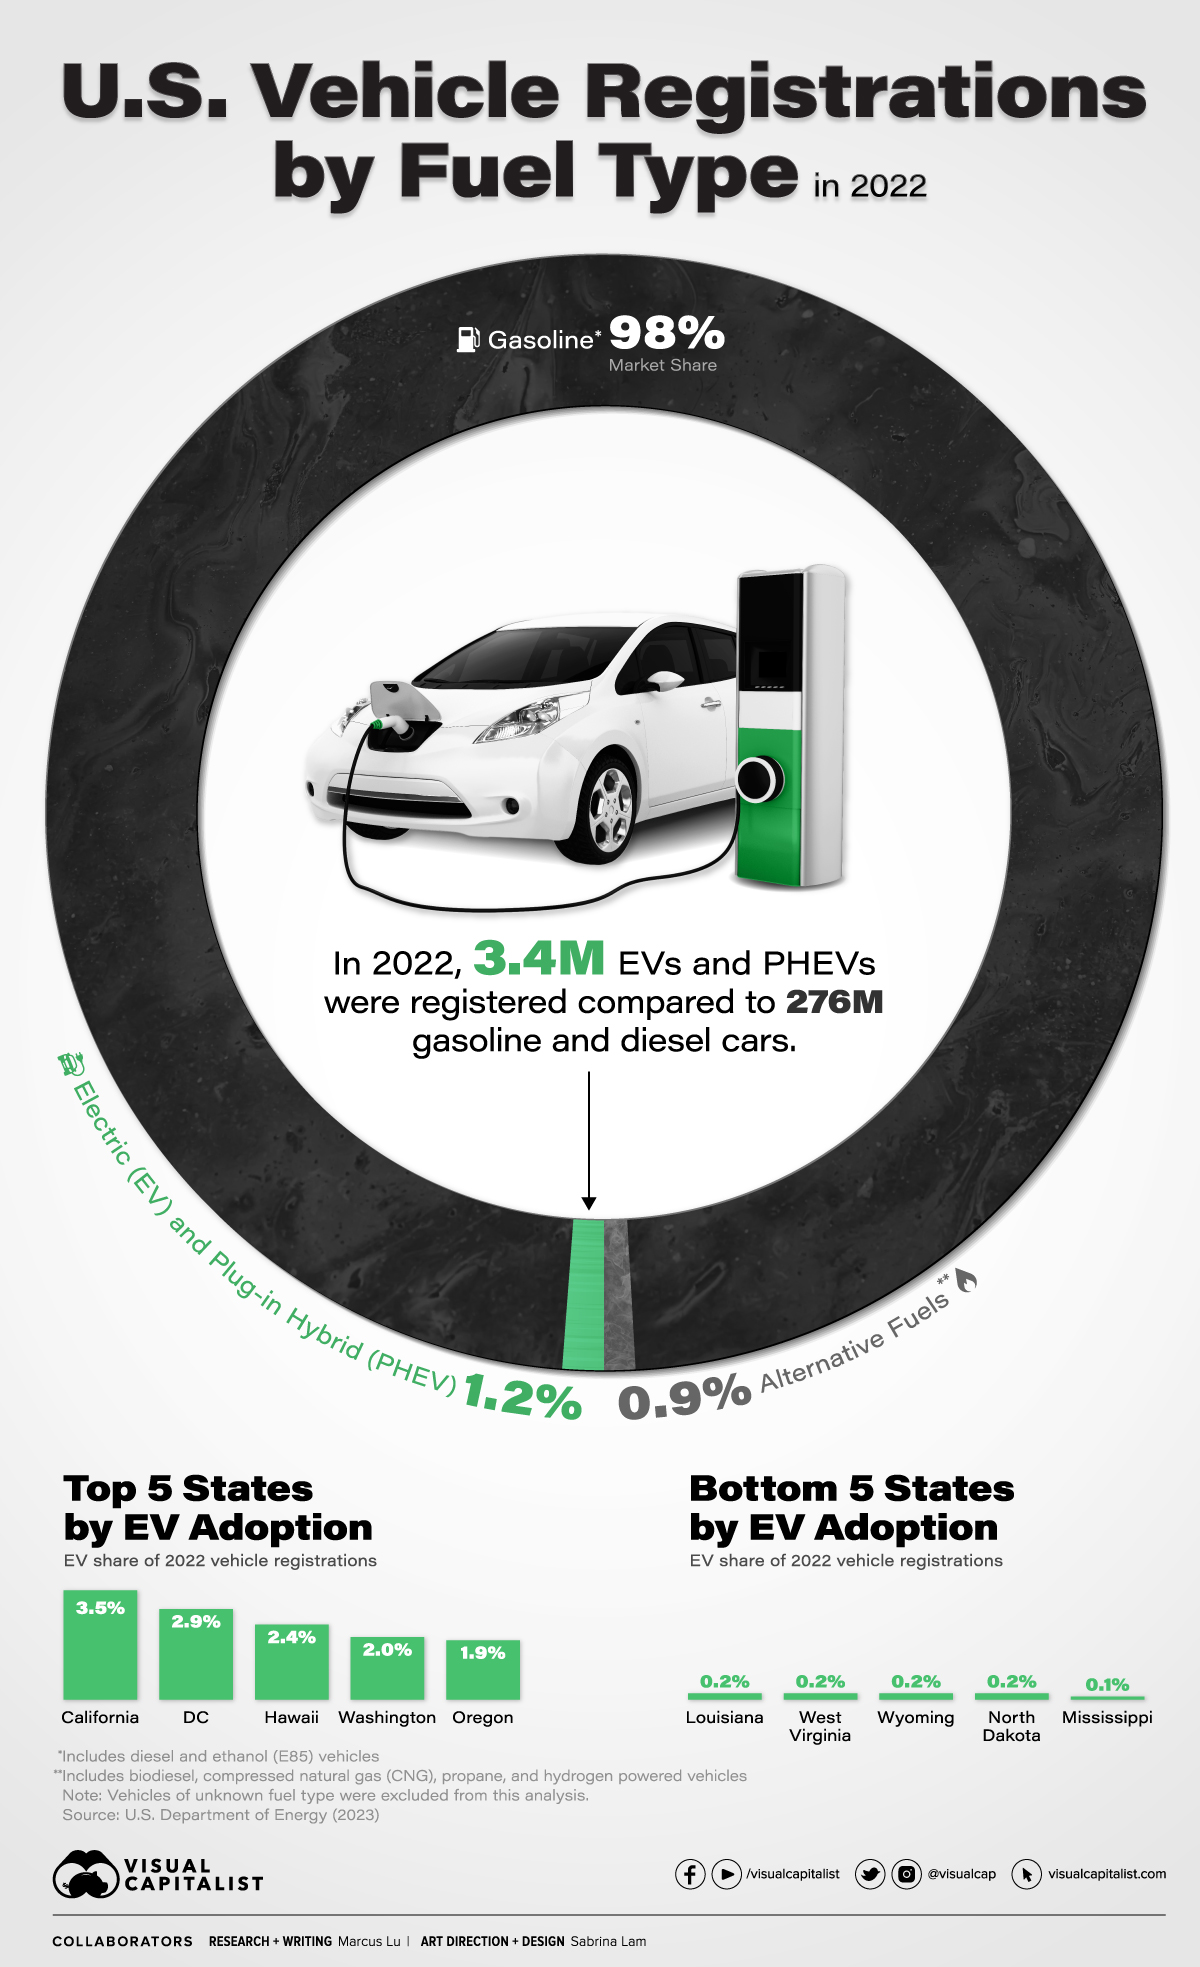
In this graphic, we visualize light-duty vehicle registrations in 2022, broken out by fuel type. It shows that out of the 281 million cars registered nationally, electric (EV) and plug-in hybrid (PHEV) vehicles represented only 1.2%.
Breaking Down the Data
An important distinction to make is that registrations are not the same as sales.
While sales represent the number of new cars sold within a timeframe, registrations reflect the number of cars that are registered with a state’s Department of Motor Vehicles (DMV).
As a result, registrations include both new cars and used cars that have changed ownership. This provides a more comprehensive measure of what cars are on the road.
The following table shows the data we used to create this graphic.
| Fuel Type | Registrations in 2022 | Share of Total |
|---|---|---|
| Gasoline | 275,728,300 | 98.0% |
| EV and PHEV | 3,454,700 | 1.2% |
| Alternative Fuels | 2,573,200 | 0.9% |
It’s worth noting that the gasoline category also includes diesel, E85 flex fuel, and traditional hybrid vehicles, while alternative fuels includes biodiesel, natural gas, propane, and hydrogen.
Vehicles that the Department of Energy categorized as “unknown fuel type” were excluded.
EV Market Share on the Rise
EV adoption in the U.S. has been relatively sluggish compared to the EU and China, though this is beginning to change as automakers roll out more electric SUVs and trucks.
According to Cox Automotive, U.S. EV sales (full battery electric) in Q2 2023 set a new record of 300,000 units, marking a 48% increase from Q2 2022.
For additional context, a total of 800,000 EVs were sold in the U.S. throughout the entire year of 2022, in addition to 190,000 PHEVs.
The post Visualized: EV Market Share in the U.S. appeared first on Visual Capitalist.