![]()
See this visualization first on the Voronoi app.
Use This Visualization
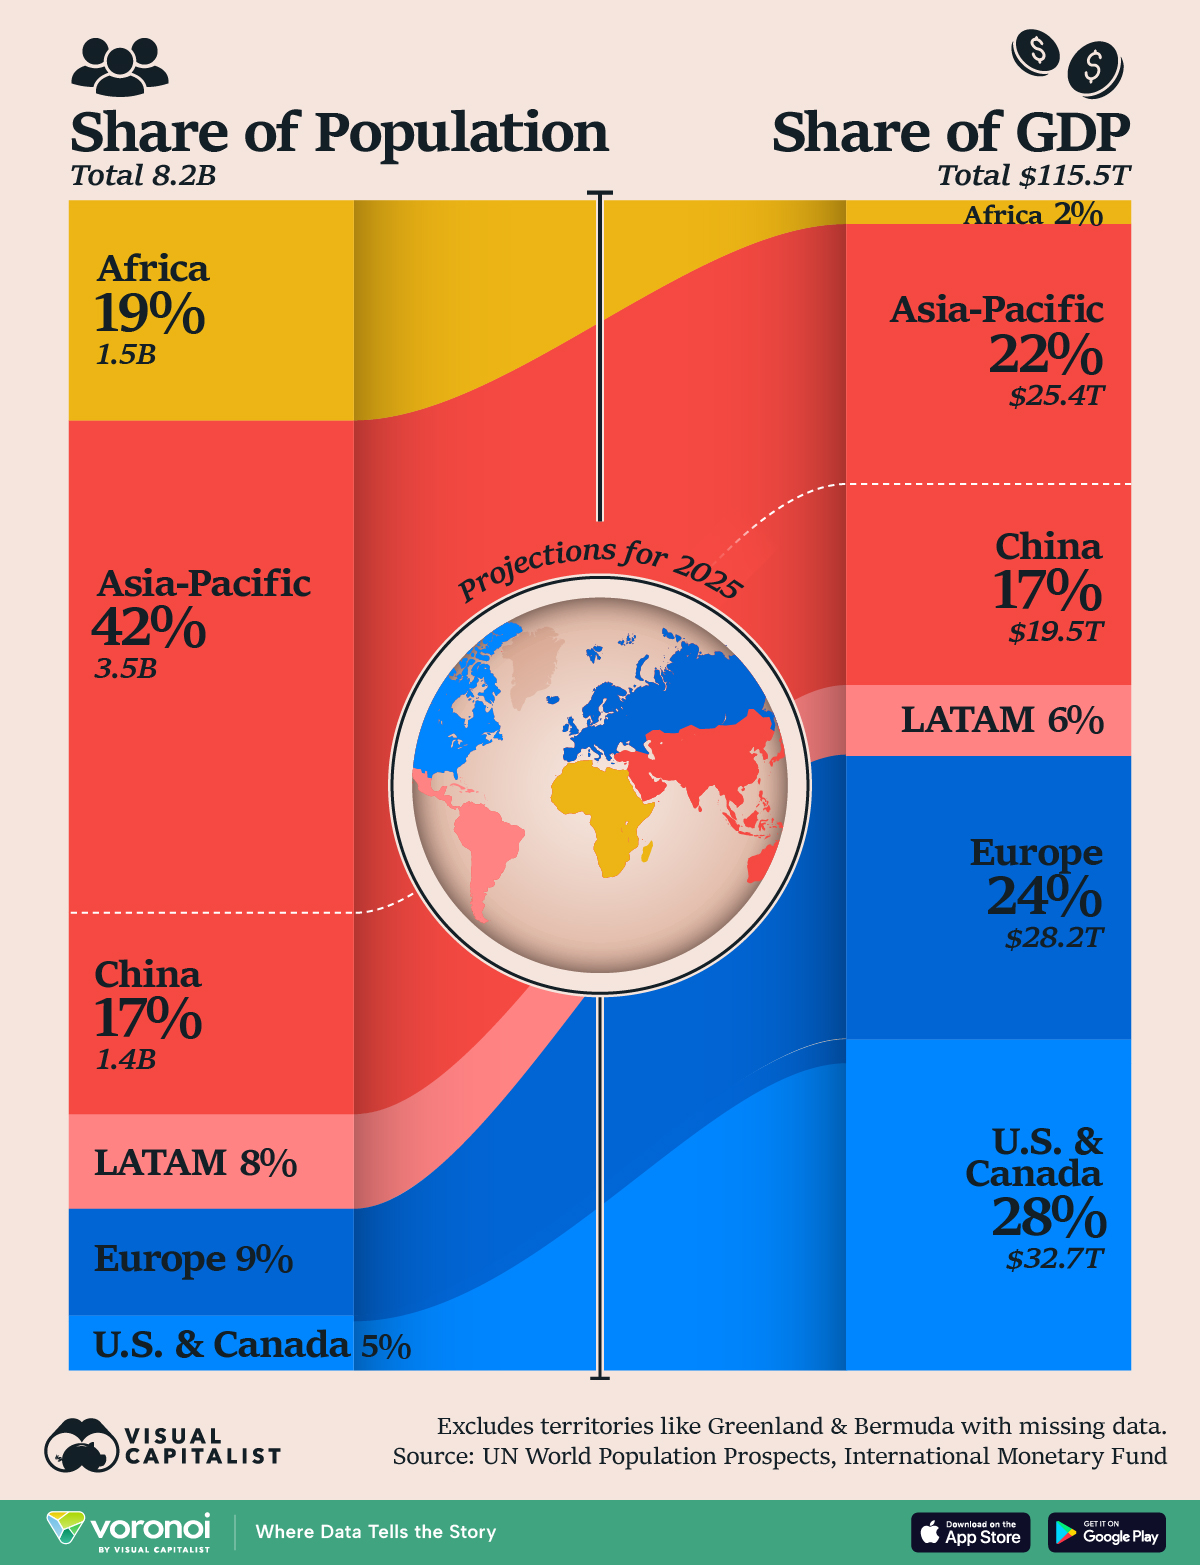
Visualized: Population vs. Economic Power by Global Region
This was originally posted on our Voronoi app. Download the app for free on iOS or Android and discover incredible data-driven charts from a variety of trusted sources.
Key Takeaways
- Northern America and Europe hold the most economic power especially for their population size.
- Together they account for more than half of global GDP with only 15% of the population.
- Africa is a significant underperformer for its population size.
In an increasingly tumultuous global economic landscape—where trade wars roil markets, industries, and jobs—where exactly does economic power lie?
And how much is it relative to a region’s population?
This graphic compares five major world regions by their share of global population vs. GDP. These 2025 projections for population and economic output come from the UN and International Monetary Fund (last updated October 2024).
Each region’s GDP is shown in nominal U.S. dollars, which can be affected by exchange rates and local prices. Adjusting for purchasing power parity would result in a very different visualization. However, using USD reflects relative global economic power, as it remains the world’s reserve currency and drives trade and investment, both crucial for growth.
Comparing Each Continent’s Population vs. GDP
Northern America and Europe are powerhouses of the world economy for their population size.
Together they account for more than half of global GDP with only 15% of the population.
| Population 2025 | Share of World Population |
GDP 2025 | Share of World GDP |
|
|---|---|---|---|---|
| Africa | 1.5B | 19% | $2.8T | 2% |
| Asia-Pacific* | 3.5B | 42% | $25.4T | 22% |
| China | 1.4B | 17% | $19.5T | 17% |
| Latin America & Caribbean |
668M | 8% | $6.9T | 6% |
| Europe | 744M | 9% | $28.2T | 24% |
| U.S. & Canada | 388M | 5% | $32.7T | 28% |
| World | 8.2B | 100% | $115.4T | 100% |
*Excludes China; includes the Caucasus, Middle East, Türkiye, and Oceania. Figures may not sum exactly due to rounding.
Every other region underperforms its population weight. Latin America’s only slightly off: 8% of the global population, with 6% of the GDP.
On the other hand, Asia has 60% of the world’s population but contributes only 40% of the GDP.
Within that region, China itself is carrying its fair share: 17% population vs 17% of world GDP.
Finally there’s Africa, the world’s youngest continent by median age and where many of the world’s future humans will be born.
The Africa Story
The second-most populous continent only contributes 2% to the global economy. For context, the region’s entire economic output equals that of France (roughly $3T).
For decades economists have been bullish on Africa, citing how with the right investment and public health measures, the region’s young and growing populace could push consumer demand and increase economic activity.
However one-third of the 1.5 billion population still lives in poverty. Per capita GDP has only increased to $2,000 from $1,000 in the past 45 years.
Research has identified many historical shocks to the economy, including the slave trade and colonization, as well as the lack of institution building, to explain part of the region’s struggles.
Learn More on the Voronoi App ![]()
Want a quick look at the entire world economy? We have you covered. Check out: The $115 Trillion World Economy in One Chart.