![]()
See this visualization first on the Voronoi app.
Visualizing 170 Years of Cumulative GHG Emissions
This was originally posted on our Voronoi app. Download the app for free on iOS or Android and discover incredible data-driven charts from a variety of trusted sources.
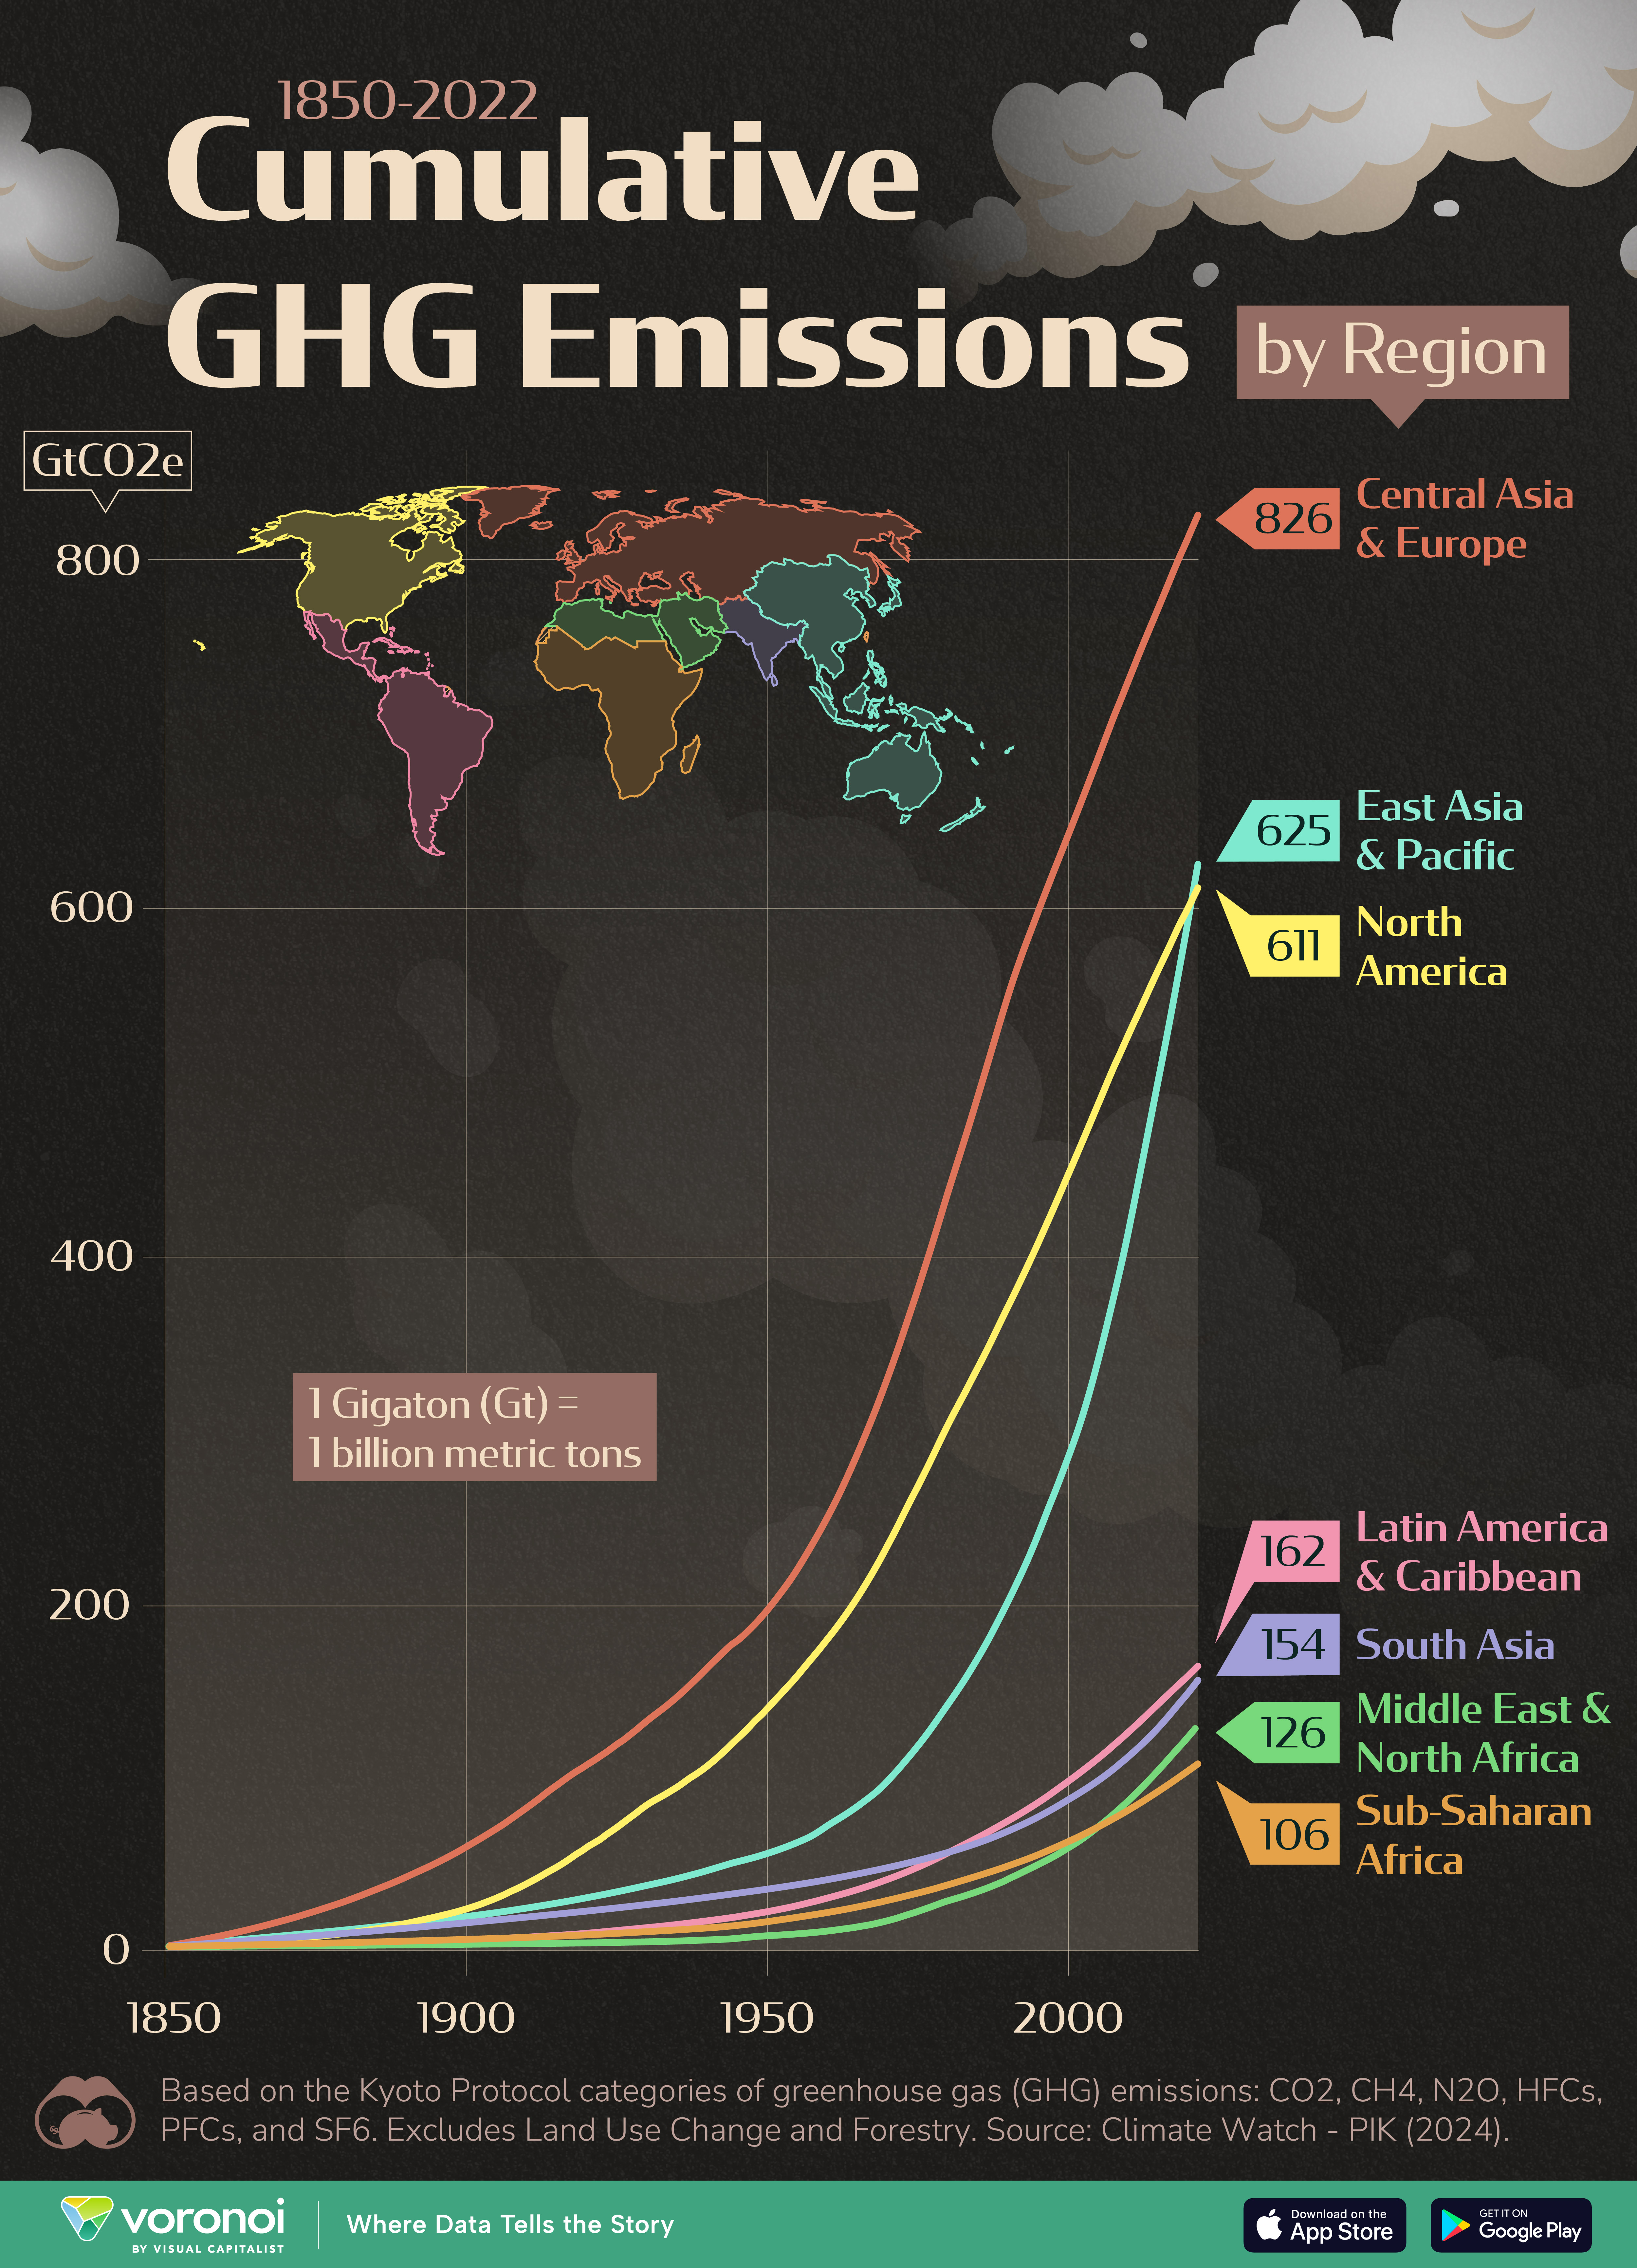
In this graphic, we provide a unique perspective on global climate emissions by visualizing cumulative GHG emissions by region, from 1850 to 2022.
All figures were sourced from Climate Watch (PIK PRIMAP-hist dataset), and are represented in gigatons of CO₂ equivalent. One gigaton is equal to one billion metric tons.
Data and Key Takeaways
The numbers we used to create this graphic are listed in the table below. All figures in GtCO₂e.
Note that these totals are based on the Kyoto Protocol categories of GHG emissions: CO₂, CH₄, N₂O, HFCs, PFCs, and SF₆. This data also excludes emissions from “land use change and forestry”.
| Year | East Asia & Pacific |
Europe & Central Asia |
Latin America & Caribbean |
Middle East & North Africa |
North America |
South Asia |
Sub-Saharan Africa |
|---|---|---|---|---|---|---|---|
| 1850 | 318 | 601 | 52 | 21 | 146 | 235 | 67 |
| 1851 | 634 | 1,203 | 105 | 42 | 302 | 472 | 134 |
| 1852 | 950 | 1,813 | 158 | 63 | 462 | 710 | 202 |
| 1853 | 1,266 | 2,435 | 213 | 84 | 629 | 949 | 270 |
| 1854 | 1,581 | 3,102 | 268 | 105 | 802 | 1,190 | 339 |
| 1855 | 1,896 | 3,769 | 324 | 127 | 985 | 1,432 | 408 |
| 1856 | 2,209 | 4,459 | 380 | 148 | 1,172 | 1,675 | 477 |
| 1857 | 2,522 | 5,152 | 438 | 170 | 1,364 | 1,919 | 547 |
| 1858 | 2,833 | 5,851 | 496 | 192 | 1,559 | 2,164 | 618 |
| 1859 | 3,145 | 6,567 | 555 | 214 | 1,760 | 2,411 | 689 |
| 1860 | 3,456 | 7,317 | 615 | 237 | 1,967 | 2,660 | 760 |
| 1861 | 3,768 | 8,092 | 676 | 259 | 2,172 | 2,909 | 832 |
| 1862 | 4,079 | 8,874 | 737 | 282 | 2,382 | 3,159 | 904 |
| 1863 | 4,390 | 9,676 | 799 | 304 | 2,603 | 3,411 | 977 |
| 1864 | 4,701 | 10,511 | 862 | 327 | 2,829 | 3,664 | 1,050 |
| 1865 | 5,013 | 11,377 | 925 | 350 | 3,057 | 3,918 | 1,124 |
| 1866 | 5,325 | 12,262 | 989 | 373 | 3,288 | 4,173 | 1,198 |
| 1867 | 5,637 | 13,168 | 1,054 | 397 | 3,536 | 4,428 | 1,272 |
| 1868 | 5,949 | 14,081 | 1,120 | 420 | 3,796 | 4,685 | 1,347 |
| 1869 | 6,261 | 15,019 | 1,186 | 444 | 4,069 | 4,943 | 1,423 |
| 1870 | 6,573 | 15,965 | 1,253 | 467 | 4,351 | 5,204 | 1,499 |
| 1871 | 6,886 | 16,947 | 1,321 | 492 | 4,642 | 5,465 | 1,575 |
| 1872 | 7,203 | 17,979 | 1,390 | 516 | 4,963 | 5,727 | 1,653 |
| 1873 | 7,522 | 19,046 | 1,460 | 541 | 5,304 | 5,991 | 1,731 |
| 1874 | 7,845 | 20,075 | 1,532 | 566 | 5,645 | 6,257 | 1,811 |
| 1875 | 8,172 | 21,170 | 1,604 | 592 | 5,993 | 6,525 | 1,892 |
| 1876 | 8,501 | 22,286 | 1,678 | 618 | 6,343 | 6,794 | 1,974 |
| 1877 | 8,833 | 23,407 | 1,753 | 645 | 6,716 | 7,065 | 2,057 |
| 1878 | 9,169 | 24,541 | 1,829 | 672 | 7,091 | 7,338 | 2,142 |
| 1879 | 9,509 | 25,699 | 1,906 | 700 | 7,506 | 7,612 | 2,227 |
| 1880 | 9,852 | 26,948 | 1,984 | 727 | 7,955 | 7,888 | 2,314 |
| 1881 | 10,198 | 28,222 | 2,063 | 756 | 8,420 | 8,166 | 2,401 |
| 1882 | 10,546 | 29,528 | 2,145 | 784 | 8,917 | 8,447 | 2,489 |
| 1883 | 10,898 | 30,883 | 2,228 | 813 | 9,438 | 8,730 | 2,577 |
| 1884 | 11,254 | 32,235 | 2,312 | 842 | 9,978 | 9,016 | 2,666 |
| 1885 | 11,612 | 33,593 | 2,399 | 872 | 10,525 | 9,304 | 2,755 |
| 1886 | 11,974 | 34,955 | 2,486 | 902 | 11,092 | 9,594 | 2,845 |
| 1887 | 12,340 | 36,352 | 2,577 | 932 | 11,684 | 9,887 | 2,936 |
| 1888 | 12,708 | 37,806 | 2,669 | 962 | 12,358 | 10,183 | 3,027 |
| 1889 | 13,081 | 39,308 | 2,764 | 993 | 12,987 | 10,481 | 3,119 |
| 1890 | 13,458 | 40,858 | 2,862 | 1,025 | 13,700 | 10,784 | 3,212 |
| 1891 | 13,841 | 42,452 | 2,961 | 1,056 | 14,446 | 11,087 | 3,306 |
| 1892 | 14,227 | 44,036 | 3,064 | 1,088 | 15,220 | 11,392 | 3,401 |
| 1893 | 14,617 | 45,599 | 3,168 | 1,121 | 16,003 | 11,697 | 3,498 |
| 1894 | 15,013 | 47,254 | 3,275 | 1,153 | 16,753 | 12,005 | 3,597 |
| 1895 | 15,415 | 48,946 | 3,385 | 1,186 | 17,568 | 12,314 | 3,697 |
| 1896 | 15,821 | 50,695 | 3,497 | 1,219 | 18,386 | 12,625 | 3,799 |
| 1897 | 16,232 | 52,510 | 3,611 | 1,253 | 19,230 | 12,937 | 3,902 |
| 1898 | 16,651 | 54,373 | 3,728 | 1,287 | 20,128 | 13,252 | 4,007 |
| 1899 | 17,074 | 56,328 | 3,848 | 1,321 | 21,124 | 13,569 | 4,113 |
| 1900 | 17,509 | 58,358 | 3,970 | 1,355 | 22,167 | 13,889 | 4,216 |
| 1901 | 17,954 | 60,381 | 4,101 | 1,390 | 23,285 | 14,210 | 4,321 |
| 1902 | 18,404 | 62,410 | 4,236 | 1,424 | 24,456 | 14,532 | 4,430 |
| 1903 | 18,863 | 64,501 | 4,376 | 1,460 | 25,779 | 14,854 | 4,542 |
| 1904 | 19,331 | 66,628 | 4,522 | 1,495 | 27,099 | 15,177 | 4,655 |
| 1905 | 19,806 | 68,798 | 4,672 | 1,531 | 28,541 | 15,501 | 4,771 |
| 1906 | 20,309 | 71,027 | 4,830 | 1,567 | 30,046 | 15,827 | 4,889 |
| 1907 | 20,821 | 73,440 | 4,993 | 1,603 | 31,762 | 16,155 | 5,009 |
| 1908 | 21,350 | 75,890 | 5,164 | 1,639 | 33,309 | 16,487 | 5,131 |
| 1909 | 21,878 | 78,347 | 5,337 | 1,676 | 34,985 | 16,817 | 5,256 |
| 1910 | 22,415 | 80,836 | 5,519 | 1,713 | 36,787 | 17,145 | 5,384 |
| 1911 | 22,975 | 83,366 | 5,711 | 1,750 | 38,590 | 17,476 | 5,514 |
| 1912 | 23,525 | 85,972 | 5,909 | 1,789 | 40,500 | 17,813 | 5,647 |
| 1913 | 24,090 | 88,742 | 6,115 | 1,828 | 42,544 | 18,154 | 5,785 |
| 1914 | 24,673 | 91,285 | 6,320 | 1,868 | 44,436 | 18,496 | 5,924 |
| 1915 | 25,254 | 93,734 | 6,533 | 1,909 | 46,381 | 18,840 | 6,067 |
| 1916 | 25,848 | 96,260 | 6,752 | 1,952 | 48,522 | 19,186 | 6,216 |
| 1917 | 26,460 | 98,729 | 6,981 | 1,996 | 50,853 | 19,536 | 6,369 |
| 1918 | 27,087 | 101,025 | 7,221 | 2,042 | 53,279 | 19,890 | 6,524 |
| 1919 | 27,730 | 103,089 | 7,477 | 2,089 | 55,381 | 20,251 | 6,683 |
| 1920 | 28,384 | 105,376 | 7,770 | 2,138 | 57,792 | 20,602 | 6,848 |
| 1921 | 29,030 | 107,514 | 8,079 | 2,189 | 59,839 | 20,959 | 7,015 |
| 1922 | 29,691 | 109,847 | 8,396 | 2,243 | 61,885 | 21,319 | 7,181 |
| 1923 | 30,372 | 112,130 | 8,712 | 2,301 | 64,487 | 21,684 | 7,355 |
| 1924 | 31,071 | 114,667 | 9,037 | 2,361 | 66,842 | 22,055 | 7,534 |
| 1925 | 31,778 | 117,192 | 9,363 | 2,423 | 69,275 | 22,428 | 7,718 |
| 1926 | 32,487 | 119,479 | 9,687 | 2,486 | 71,889 | 22,806 | 7,907 |
| 1927 | 33,221 | 122,218 | 10,012 | 2,553 | 74,461 | 23,189 | 8,099 |
| 1928 | 33,966 | 124,961 | 10,338 | 2,622 | 77,006 | 23,573 | 8,293 |
| 1929 | 34,722 | 127,888 | 10,675 | 2,692 | 79,707 | 23,963 | 8,491 |
| 1930 | 35,473 | 130,723 | 11,010 | 2,765 | 82,153 | 24,357 | 8,688 |
| 1931 | 36,216 | 133,436 | 11,342 | 2,837 | 84,279 | 24,751 | 8,883 |
| 1932 | 36,964 | 136,025 | 11,692 | 2,913 | 86,140 | 25,146 | 9,076 |
| 1933 | 37,740 | 138,675 | 12,055 | 2,992 | 88,110 | 25,544 | 9,273 |
| 1934 | 38,547 | 141,518 | 12,431 | 3,082 | 90,191 | 25,952 | 9,475 |
| 1935 | 39,382 | 144,471 | 12,822 | 3,184 | 92,331 | 26,366 | 9,681 |
| 1936 | 40,254 | 147,573 | 13,219 | 3,291 | 94,740 | 26,783 | 9,893 |
| 1937 | 41,147 | 150,875 | 13,639 | 3,408 | 97,247 | 27,210 | 10,112 |
| 1938 | 42,052 | 154,187 | 14,064 | 3,527 | 99,426 | 27,647 | 10,337 |
| 1939 | 42,991 | 157,572 | 14,482 | 3,677 | 101,795 | 28,087 | 10,567 |
| 1940 | 43,989 | 161,092 | 14,911 | 3,812 | 104,419 | 28,534 | 10,803 |
| 1941 | 45,030 | 164,510 | 15,357 | 3,931 | 107,257 | 28,987 | 11,052 |
| 1942 | 46,058 | 167,793 | 15,808 | 4,078 | 110,308 | 29,444 | 11,322 |
| 1943 | 47,096 | 171,186 | 16,271 | 4,237 | 113,468 | 29,895 | 11,613 |
| 1944 | 48,121 | 174,325 | 16,760 | 4,426 | 116,852 | 30,353 | 11,936 |
| 1945 | 49,015 | 176,728 | 17,266 | 4,666 | 120,158 | 30,820 | 12,286 |
| 1946 | 49,868 | 179,667 | 17,856 | 5,004 | 123,395 | 31,288 | 12,664 |
| 1947 | 50,769 | 182,984 | 18,413 | 5,351 | 126,930 | 31,753 | 13,067 |
| 1948 | 51,704 | 186,520 | 18,992 | 5,654 | 130,624 | 32,219 | 13,495 |
| 1949 | 52,728 | 190,319 | 19,579 | 5,978 | 133,845 | 32,693 | 13,948 |
| 1950 | 53,792 | 194,315 | 20,190 | 6,182 | 137,487 | 33,181 | 14,422 |
| 1951 | 54,933 | 198,646 | 20,837 | 6,392 | 141,240 | 33,679 | 14,911 |
| 1952 | 56,144 | 203,119 | 21,509 | 6,592 | 144,931 | 34,188 | 15,413 |
| 1953 | 57,402 | 207,726 | 22,196 | 6,800 | 148,714 | 34,702 | 15,916 |
| 1954 | 58,730 | 212,600 | 22,908 | 7,026 | 152,383 | 35,225 | 16,424 |
| 1955 | 60,134 | 217,858 | 23,698 | 7,267 | 156,357 | 35,761 | 16,945 |
| 1956 | 61,618 | 223,444 | 24,513 | 7,520 | 160,525 | 36,307 | 17,474 |
| 1957 | 63,204 | 229,271 | 25,369 | 7,799 | 164,685 | 36,873 | 18,010 |
| 1958 | 65,141 | 235,203 | 26,182 | 8,106 | 168,786 | 37,450 | 18,556 |
| 1959 | 67,355 | 241,281 | 27,094 | 8,423 | 173,012 | 38,040 | 19,108 |
| 1960 | 69,721 | 247,666 | 28,006 | 8,807 | 177,358 | 38,651 | 19,677 |
| 1961 | 71,900 | 254,268 | 28,927 | 9,219 | 181,725 | 39,273 | 20,277 |
| 1962 | 73,998 | 261,202 | 29,859 | 9,653 | 186,277 | 39,914 | 20,892 |
| 1963 | 76,163 | 268,546 | 30,825 | 10,119 | 191,046 | 40,572 | 21,520 |
| 1964 | 78,435 | 276,183 | 31,829 | 10,582 | 196,046 | 41,233 | 22,176 |
| 1965 | 80,844 | 284,067 | 32,874 | 11,073 | 201,265 | 41,911 | 22,865 |
| 1966 | 83,395 | 292,202 | 33,948 | 11,688 | 206,722 | 42,603 | 23,571 |
| 1967 | 85,975 | 300,521 | 35,075 | 12,242 | 212,406 | 43,302 | 24,307 |
| 1968 | 88,727 | 309,140 | 36,245 | 12,894 | 218,305 | 44,027 | 25,038 |
| 1969 | 91,759 | 318,141 | 37,464 | 13,662 | 224,469 | 44,762 | 25,792 |
| 1970 | 95,258 | 327,440 | 38,721 | 14,483 | 230,941 | 45,520 | 26,640 |
| 1971 | 98,969 | 336,954 | 39,999 | 15,373 | 237,423 | 46,291 | 27,425 |
| 1972 | 102,829 | 346,798 | 41,321 | 16,327 | 244,176 | 47,075 | 28,238 |
| 1973 | 106,866 | 357,068 | 42,692 | 17,440 | 251,198 | 47,876 | 29,098 |
| 1974 | 110,937 | 367,374 | 44,133 | 18,538 | 258,035 | 48,693 | 29,939 |
| 1975 | 115,181 | 377,716 | 45,606 | 19,603 | 264,634 | 49,549 | 30,791 |
| 1976 | 119,555 | 388,521 | 47,130 | 20,778 | 271,474 | 50,424 | 31,655 |
| 1977 | 124,162 | 399,392 | 48,686 | 21,981 | 278,454 | 51,329 | 32,564 |
| 1978 | 128,966 | 410,524 | 50,337 | 23,194 | 285,604 | 52,254 | 33,473 |
| 1979 | 133,923 | 421,884 | 52,021 | 24,496 | 292,833 | 53,206 | 34,480 |
| 1980 | 138,904 | 433,223 | 53,778 | 25,733 | 299,851 | 54,179 | 35,492 |
| 1981 | 143,853 | 444,254 | 55,558 | 26,809 | 306,668 | 55,198 | 36,487 |
| 1982 | 148,944 | 455,169 | 57,345 | 27,822 | 313,123 | 56,238 | 37,532 |
| 1983 | 154,179 | 466,112 | 59,078 | 28,851 | 319,588 | 57,333 | 38,571 |
| 1984 | 159,721 | 477,179 | 60,824 | 29,947 | 326,276 | 58,456 | 39,613 |
| 1985 | 165,459 | 488,623 | 62,603 | 31,094 | 332,952 | 59,634 | 40,670 |
| 1986 | 171,365 | 500,121 | 64,419 | 32,300 | 339,567 | 60,865 | 41,736 |
| 1987 | 177,530 | 511,650 | 66,296 | 33,542 | 346,418 | 62,132 | 42,845 |
| 1988 | 184,071 | 523,291 | 68,199 | 34,877 | 353,523 | 63,473 | 43,941 |
| 1989 | 190,810 | 534,913 | 70,151 | 36,299 | 360,709 | 64,883 | 45,090 |
| 1990 | 197,596 | 546,169 | 72,112 | 37,725 | 367,792 | 66,336 | 46,284 |
| 1991 | 204,628 | 557,017 | 74,110 | 39,504 | 374,788 | 67,840 | 47,504 |
| 1992 | 211,839 | 567,057 | 76,132 | 41,074 | 381,921 | 69,392 | 48,727 |
| 1993 | 219,296 | 576,687 | 78,208 | 42,752 | 389,166 | 70,986 | 49,984 |
| 1994 | 227,136 | 585,808 | 80,342 | 44,438 | 396,531 | 72,644 | 51,282 |
| 1995 | 235,493 | 594,857 | 82,542 | 46,113 | 403,993 | 74,376 | 52,647 |
| 1996 | 244,228 | 603,944 | 84,811 | 47,835 | 411,677 | 76,209 | 54,067 |
| 1997 | 253,113 | 612,806 | 87,180 | 49,569 | 419,437 | 78,102 | 55,543 |
| 1998 | 261,701 | 621,615 | 89,656 | 51,390 | 427,253 | 80,035 | 57,052 |
| 1999 | 270,518 | 630,263 | 92,140 | 53,306 | 435,132 | 82,063 | 58,564 |
| 2000 | 279,675 | 638,954 | 94,627 | 55,370 | 443,225 | 84,143 | 60,123 |
| 2001 | 289,034 | 647,732 | 97,151 | 57,482 | 451,199 | 86,223 | 61,708 |
| 2002 | 298,911 | 656,489 | 99,721 | 59,628 | 459,218 | 88,325 | 63,322 |
| 2003 | 309,766 | 665,400 | 102,361 | 61,946 | 467,306 | 90,495 | 65,014 |
| 2004 | 321,598 | 674,361 | 105,042 | 64,436 | 475,517 | 92,749 | 66,762 |
| 2005 | 334,376 | 683,330 | 107,800 | 67,049 | 483,733 | 95,083 | 68,550 |
| 2006 | 347,834 | 692,429 | 110,609 | 69,786 | 491,872 | 97,523 | 70,347 |
| 2007 | 361,787 | 701,515 | 113,506 | 72,525 | 500,135 | 100,085 | 72,222 |
| 2008 | 376,171 | 710,524 | 116,547 | 75,434 | 508,160 | 102,782 | 74,140 |
| 2009 | 390,938 | 718,903 | 119,533 | 78,442 | 515,683 | 105,661 | 76,042 |
| 2010 | 406,591 | 727,530 | 122,623 | 81,574 | 523,439 | 108,561 | 78,050 |
| 2011 | 423,457 | 736,127 | 125,758 | 84,740 | 531,054 | 111,589 | 80,120 |
| 2012 | 440,767 | 744,700 | 128,959 | 88,104 | 538,434 | 114,738 | 82,200 |
| 2013 | 458,294 | 753,108 | 132,214 | 91,507 | 546,001 | 117,979 | 84,334 |
| 2014 | 476,019 | 761,337 | 135,522 | 95,063 | 553,615 | 121,352 | 86,563 |
| 2015 | 493,676 | 769,564 | 138,819 | 98,727 | 561,071 | 124,947 | 88,803 |
| 2016 | 511,223 | 777,815 | 142,124 | 102,435 | 568,349 | 128,725 | 91,069 |
| 2017 | 529,071 | 786,165 | 145,427 | 106,249 | 575,614 | 132,684 | 93,386 |
| 2018 | 547,504 | 794,541 | 148,696 | 110,129 | 583,082 | 136,780 | 95,752 |
| 2019 | 566,376 | 802,686 | 151,982 | 114,014 | 590,409 | 140,941 | 98,157 |
| 2020 | 585,439 | 810,394 | 155,122 | 117,801 | 597,081 | 144,945 | 100,566 |
| 2021 | 604,972 | 818,442 | 158,483 | 121,771 | 604,084 | 149,254 | 103,019 |
| 2022 | 624,725 | 826,261 | 161,889 | 125,887 | 611,161 | 153,693 | 105,500 |
All figures in GtCO₂e
From this graphic, we can identify the three largest regional emitters as Europe & Central Asia, East Asia & Pacific, and North America. Together, they account for 79% of global cumulative GHG emissions since 1850. This is the equivalent of 2.06 million gigatons, or 2,060,000,000,000,000 metric tons of CO₂e.
The sharp uptrends of these three regions coincides with various factors, such as industrialization, population growth, and rising consumption.
When interpreting this data, it’s interesting to consider each region’s total population. For example, the North America region (U.S. and Canada) has a population of around 375 million people, which is far less than the 2.4 billion in East Asia & Pacific.
As the latter continues to become more developed, it’s likely to surpass Central Asia & Europe as well, given the very steep trajectory shown in this graphic.
Learn More About Global Emissions From Visual Capitalist
If you enjoyed this graphic, be sure to check out Ranked: Per Capita Carbon Emissions by Country.
The post Visualizing 170 Years of Cumulative GHG Emissions appeared first on Visual Capitalist.