Visualizing BlackRock’s Top 25 Equity Holdings
Founded just 34 years ago in 1988, BlackRock has quickly become the world’s largest asset manager with over $9 trillion in assets under management (AUM).
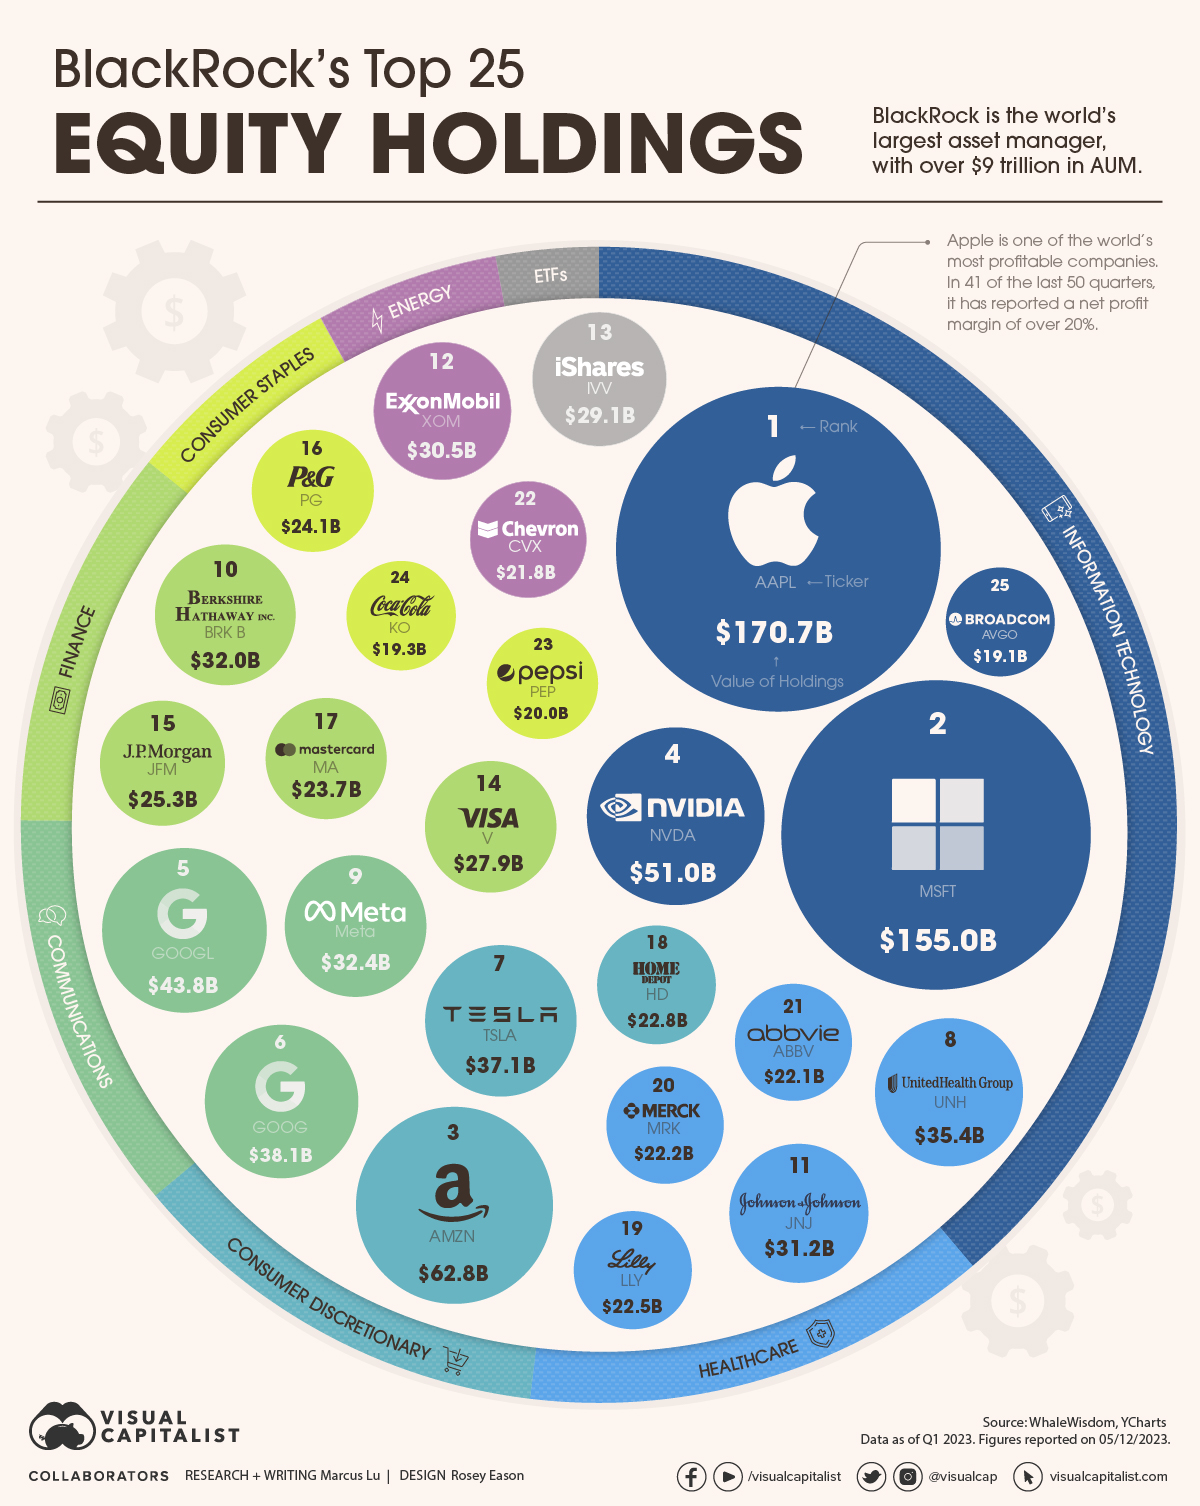
Given this status, BlackRock’s equity portfolio may provide useful insights to investors. To learn more, we’ve visualized the firm’s top 25 equity holdings as of Q1 2023. At that time, these 25 positions were worth over $1 trillion, and they represented about 30% of BlackRock’s overall equity portfolio.
Top 25 Data
The following table shows the data we used to create this infographic. These figures come from BlackRock’s latest 13F filing, which was released on May 12.
The 13F is a mandatory, quarterly report that is filed by institutional investment managers with over $100 million in AUM.
| Rank | Name | Sector | Value of Holdings (USD billions) |
|---|---|---|---|
| 1 | Apple | Information Technology | $171 |
| 2 | Microsoft | Information Technology | $155 |
| 3 | Amazon | Consumer Discretionary | $63 |
| 4 | Nvidia | Information Technology | $51 |
| 5 | Google (Class A) | Communications | $44 |
| 6 | Google (Class C) | Communications | $38 |
| 7 | Tesla | Consumer Discretionary | $37 |
| 8 | UnitedHealth Group | Health Care | $35 |
| 9 | Meta | Communications | $32 |
| 10 | Berkshire Hathaway (Class B) | Finance | $32 |
| 11 | Johnson & Johnson | Health Care | $31 |
| 12 | Exxon Mobil | Energy | $30 |
| 13 | iShares Core S&P 500 ETF | ETF | $29 |
| 14 | Visa | Finance | $28 |
| 15 | JPMorgan Chase & Co | Finance | $25 |
| 16 | Procter & Gamble Co | Consumer Staples | $24 |
| 17 | Mastercard | Finance | $24 |
| 18 | Home Depot | Consumer Discretionary | $23 |
| 19 | Eli Lilly And Co | Health Care | $23 |
| 20 | Merck & Co | Health Care | $22 |
| 21 | AbbVie | Health Care | $22 |
| 22 | Chevron | Energy | $22 |
| 23 | PepsiCo | Consumer Staples | $20 |
| 24 | Coca-Cola Co | Consumer Staples | $19 |
| 25 | Broadcom | Information Technology | $19 |
As expected, BlackRock’s top equity holdings include America’s most established tech companies: Apple, Microsoft, Amazon, and Google.
BlackRock also has large positions in Nvidia and Broadcom, which happen to be America’s two largest semiconductor companies. Given Nvidia’s incredible YTD performance (198% as of June 19th), this position has likely grown even bigger.
Altogether, tech stocks make up 39% of this top 25 list. The next biggest sector would be healthcare, at 13% of the total value.
Ownership Stakes
How much of a controlling stake does BlackRock have in these companies? We answer this question in the following table, which again uses Q1 2023 data.
| Name | % Ownership | Quarter 1st Owned |
|---|---|---|
| Merck & Co | 8.24% | Q3 2007 |
| UnitedHealth Group | 8.02% | Q4 2008 |
| Berkshire Hathaway (Class B) | 7.98% | Q3 2007 |
| PepsiCo | 7.96% | Q3 2007 |
| AbbVie | 7.86% | Q1 2013 |
| Home Depot | 7.60% | Q3 2007 |
| Nvidia | 7.44% | Q3 2007 |
| Microsoft | 7.22% | Q3 2007 |
| Coca-Cola Co | 7.20% | Q3 2007 |
| Broadcom | 7.16% | Q3 2009 |
| Google (Class A) | 7.09% | Q3 2007 |
| Chevron | 7.02% | Q3 2007 |
| Eli Lilly And Co | 6.90% | Q3 2007 |
| Mastercard | 6.89% | Q3 2007 |
| Procter & Gamble Co | 6.86% | Q3 2007 |
| Exxon Mobil | 6.83% | Q3 2007 |
| JPMorgan Chase & Co | 6.59% | Q3 2007 |
| Visa | 6.55% | Q2 2008 |
| Apple | 6.54% | Q3 2007 |
| Johnson & Johnson | 6.46% | Q3 2007 |
| Google (Class C) | 6.13% | Q2 2014 |
| Amazon | 5.93% | Q4 2008 |
| Tesla | 5.70% | Q3 2010 |
| Meta | 5.69% | Q2 2012 |
Google’s Class C shares (Ticker: GOOG) do not offer voting rights.
When it comes to shareholder voting, BlackRock has historically voted on behalf of its clients to “advance their long-term economic interests.” Given its massive size, some people believe that BlackRock has too much influence on major corporations.
In 2021, it was reported that BlackRock would begin allowing some institutional clients to cast their own votes at shareholder meetings.
The post Visualizing BlackRock’s Top Equity Holdings appeared first on Visual Capitalist.