![]()
See this visualization first on the Voronoi app.
Use This Visualization
China’s Urban Housing Decline
This was originally posted on our Voronoi app. Download the app for free on iOS or Android and discover incredible data-driven charts from a variety of trusted sources.
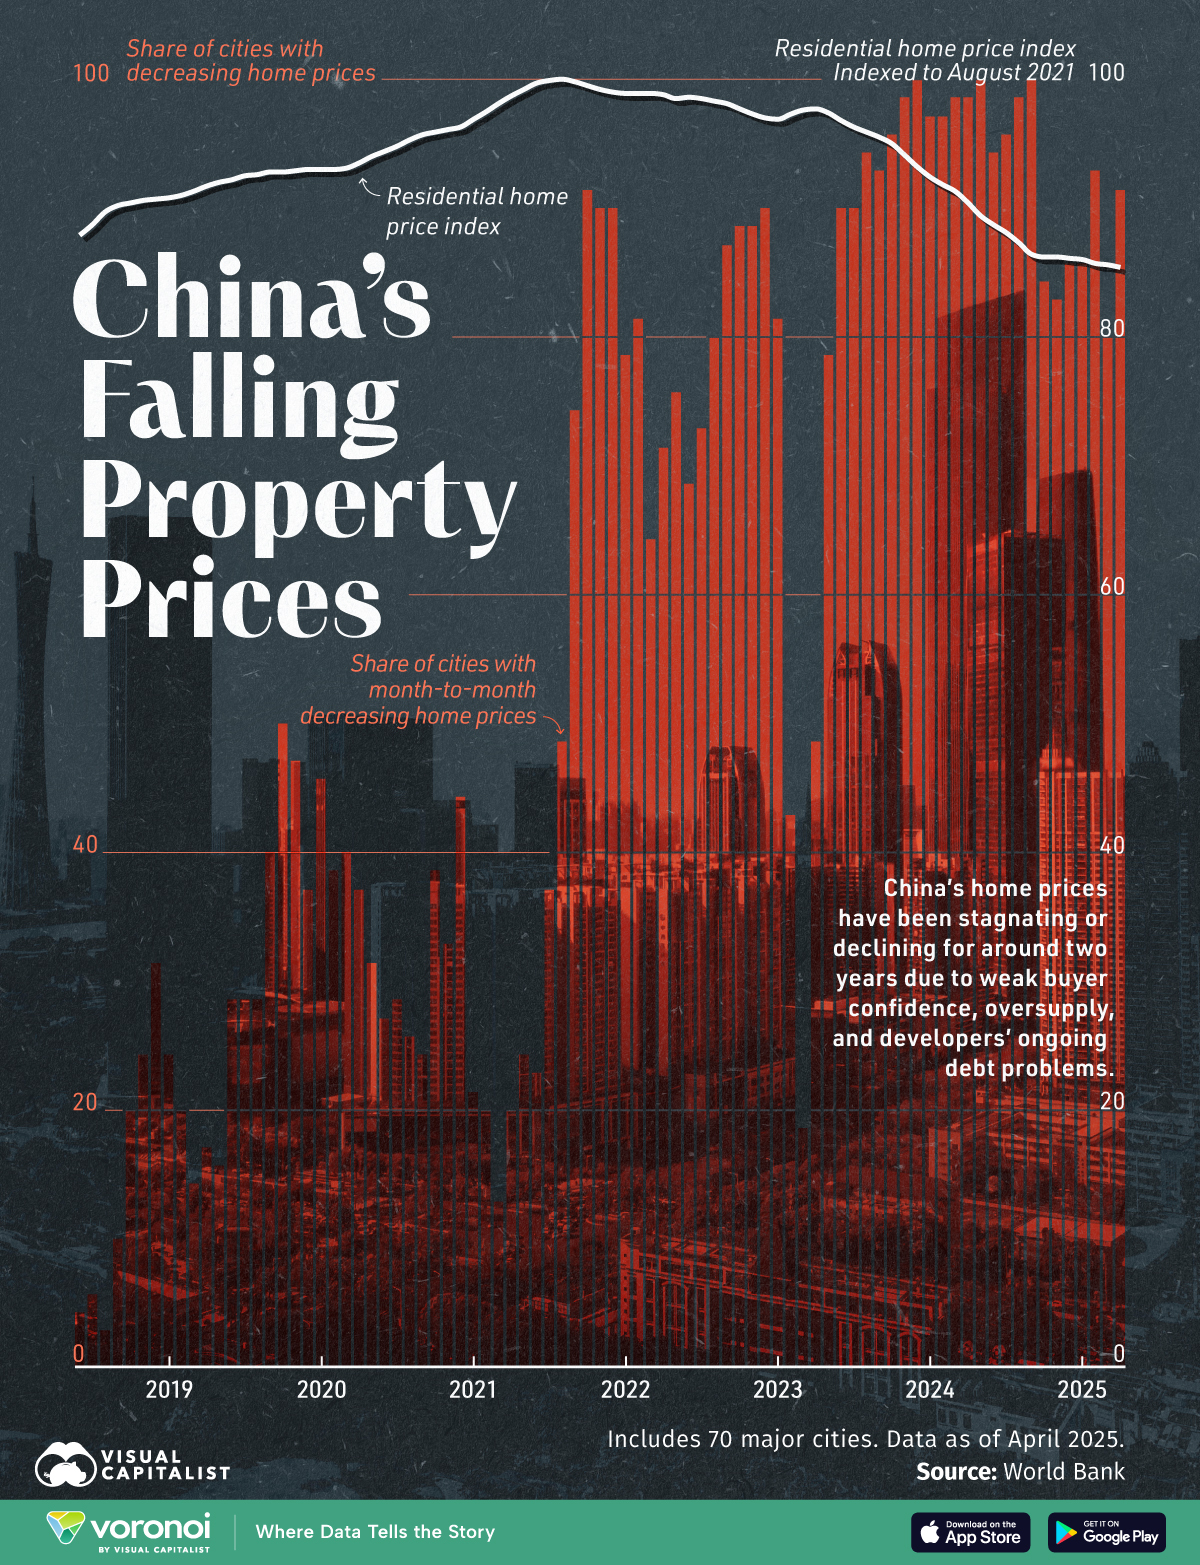
China’s real estate sector, once a key engine of the country’s economic growth, is experiencing a protracted downturn.
This graphic shows the share of Chinese cities with month-to-month decreasing home prices and China’s residential home price index (indexed to August 2021) from June 2018 to April 2025.
Data comes from World Bank, and includes 70 major Chinese cities.
China’s Real Estate Market Is In a Slump
Below, we show the share of Chinese cities with month-to-month decreasing home prices and China’s residential home price index from June 2018 to April 2025.
| Date | % of cities with MoM decreasing home prices |
Home price index |
|---|---|---|
| Jun-18 | 4.3 | 87.9 |
| Jul-18 | 5.7 | 88.7 |
| Aug-18 | 2.9 | 89.7 |
| Sep-18 | 10 | 90.2 |
| Oct-18 | 20 | 90.4 |
| Nov-18 | 24.3 | 90.6 |
| Dec-18 | 31.4 | 90.7 |
| Jan-19 | 24.3 | 90.8 |
| Feb-19 | 20 | 91 |
| Mar-19 | 14.3 | 91.3 |
| Apr-19 | 17.1 | 91.7 |
| May-19 | 15.7 | 92 |
| Jun-19 | 28.6 | 92.2 |
| Jul-19 | 28.6 | 92.5 |
| Aug-19 | 28.6 | 92.6 |
| Sep-19 | 40 | 92.8 |
| Oct-19 | 50 | 92.8 |
| Nov-19 | 47.1 | 92.9 |
| Dec-19 | 37.1 | 93 |
| Jan-20 | 45.7 | 93 |
| Feb-20 | 38.6 | 93 |
| Mar-20 | 40 | 93.1 |
| Apr-20 | 37.1 | 93.5 |
| May-20 | 31.4 | 94 |
| Jun-20 | 27.1 | 94.4 |
| Jul-20 | 28.6 | 94.8 |
| Aug-20 | 25.7 | 95.3 |
| Sep-20 | 24.3 | 95.7 |
| Oct-20 | 38.6 | 95.9 |
| Nov-20 | 32.9 | 96.1 |
| Dec-20 | 44.3 | 96.3 |
| Jan-21 | 21.4 | 96.9 |
| Feb-21 | 20 | 97.5 |
| Mar-21 | 12.9 | 98.1 |
| Apr-21 | 20 | 98.7 |
| May-21 | 24.3 | 99.2 |
| Jun-21 | 22.9 | 99.7 |
| Jul-21 | 37.1 | 99.9 |
| Aug-21 | 48.6 | 100 |
| Sep-21 | 74.3 | 99.8 |
| Oct-21 | 91.4 | 99.5 |
| Nov-21 | 90 | 99.2 |
| Dec-21 | 90 | 99 |
| Jan-22 | 78.6 | 98.9 |
| Feb-22 | 81.4 | 98.9 |
| Mar-22 | 64.3 | 98.9 |
| Apr-22 | 71.4 | 98.8 |
| May-22 | 75.7 | 98.5 |
| Jun-22 | 68.6 | 98.6 |
| Jul-22 | 72.9 | 98.5 |
| Aug-22 | 80 | 98.3 |
| Sep-22 | 87.1 | 98.1 |
| Oct-22 | 88.6 | 97.7 |
| Nov-22 | 88.6 | 97.3 |
| Dec-22 | 90 | 97 |
| Jan-23 | 81.4 | 96.9 |
| Feb-23 | 42.9 | 97.3 |
| Mar-23 | 18.6 | 97.6 |
| Apr-23 | 48.6 | 97.7 |
| May-23 | 78.6 | 97.4 |
| Jun-23 | 90 | 96.8 |
| Jul-23 | 90 | 96.3 |
| Aug-23 | 94.3 | 95.9 |
| Sep-23 | 92.9 | 95.5 |
| Oct-23 | 95.7 | 95 |
| Nov-23 | 98.6 | 94.1 |
| Dec-23 | 100 | 93.2 |
| Jan-24 | 97.1 | 92.4 |
| Feb-24 | 97.1 | 91.8 |
| Mar-24 | 98.6 | 91.3 |
| Apr-24 | 98.6 | 90.4 |
| May-24 | 100 | 89.4 |
| Jun-24 | 94.3 | 88.7 |
| Jul-24 | 95.7 | 88.1 |
| Aug-24 | 98.6 | 87.3 |
| Sep-24 | 100 | 86.4 |
| Oct-24 | 84.3 | 86.2 |
| Nov-24 | 82.9 | 86.2 |
| Dec-24 | 85.7 | 86.1 |
| Jan-25 | 85.7 | 86 |
| Feb-25 | 92.9 | 85.7 |
| Mar-25 | 80 | 85.6 |
| Apr-25 | 91.4 | 85.4 |
The share of Chinese cities with month-to-month price drops surged dramatically, from under 30% pre-2021 to over 90% in most months since late 2023.
In September 2024, May 2024, and December 2023, all 70 cities reported falling prices.
The residential home price index has declined by over 14% since August 2021, reflecting a prolonged and broad-based downturn in the property market. This sustained decline reflects structural weaknesses in the housing market, not just cyclical downturns. Since 2022, weak buyer confidence, oversupply, and developer debt have driven prices downward.
Stricter government regulations on lending and a crackdown on speculative buying have also squeezed developers and limited new investment, deepening the downturn in one of China’s most vital economic sectors.
However, there is still demand in some of China’s major housing markets. In Shanghai, $1 million buys just 474 square feet of prime real estate, a 47% decline in buying power over the past decade, highlighting how top-tier Chinese cities continue to attract high-end buyers despite the broader market slump.
Learn More on the Voronoi App ![]()
To learn about China’s real estate crisis, check out this graphic that looks at China’s apartment and commercial property sales and housing starts.