![]()
See this visualization first on the Voronoi app.
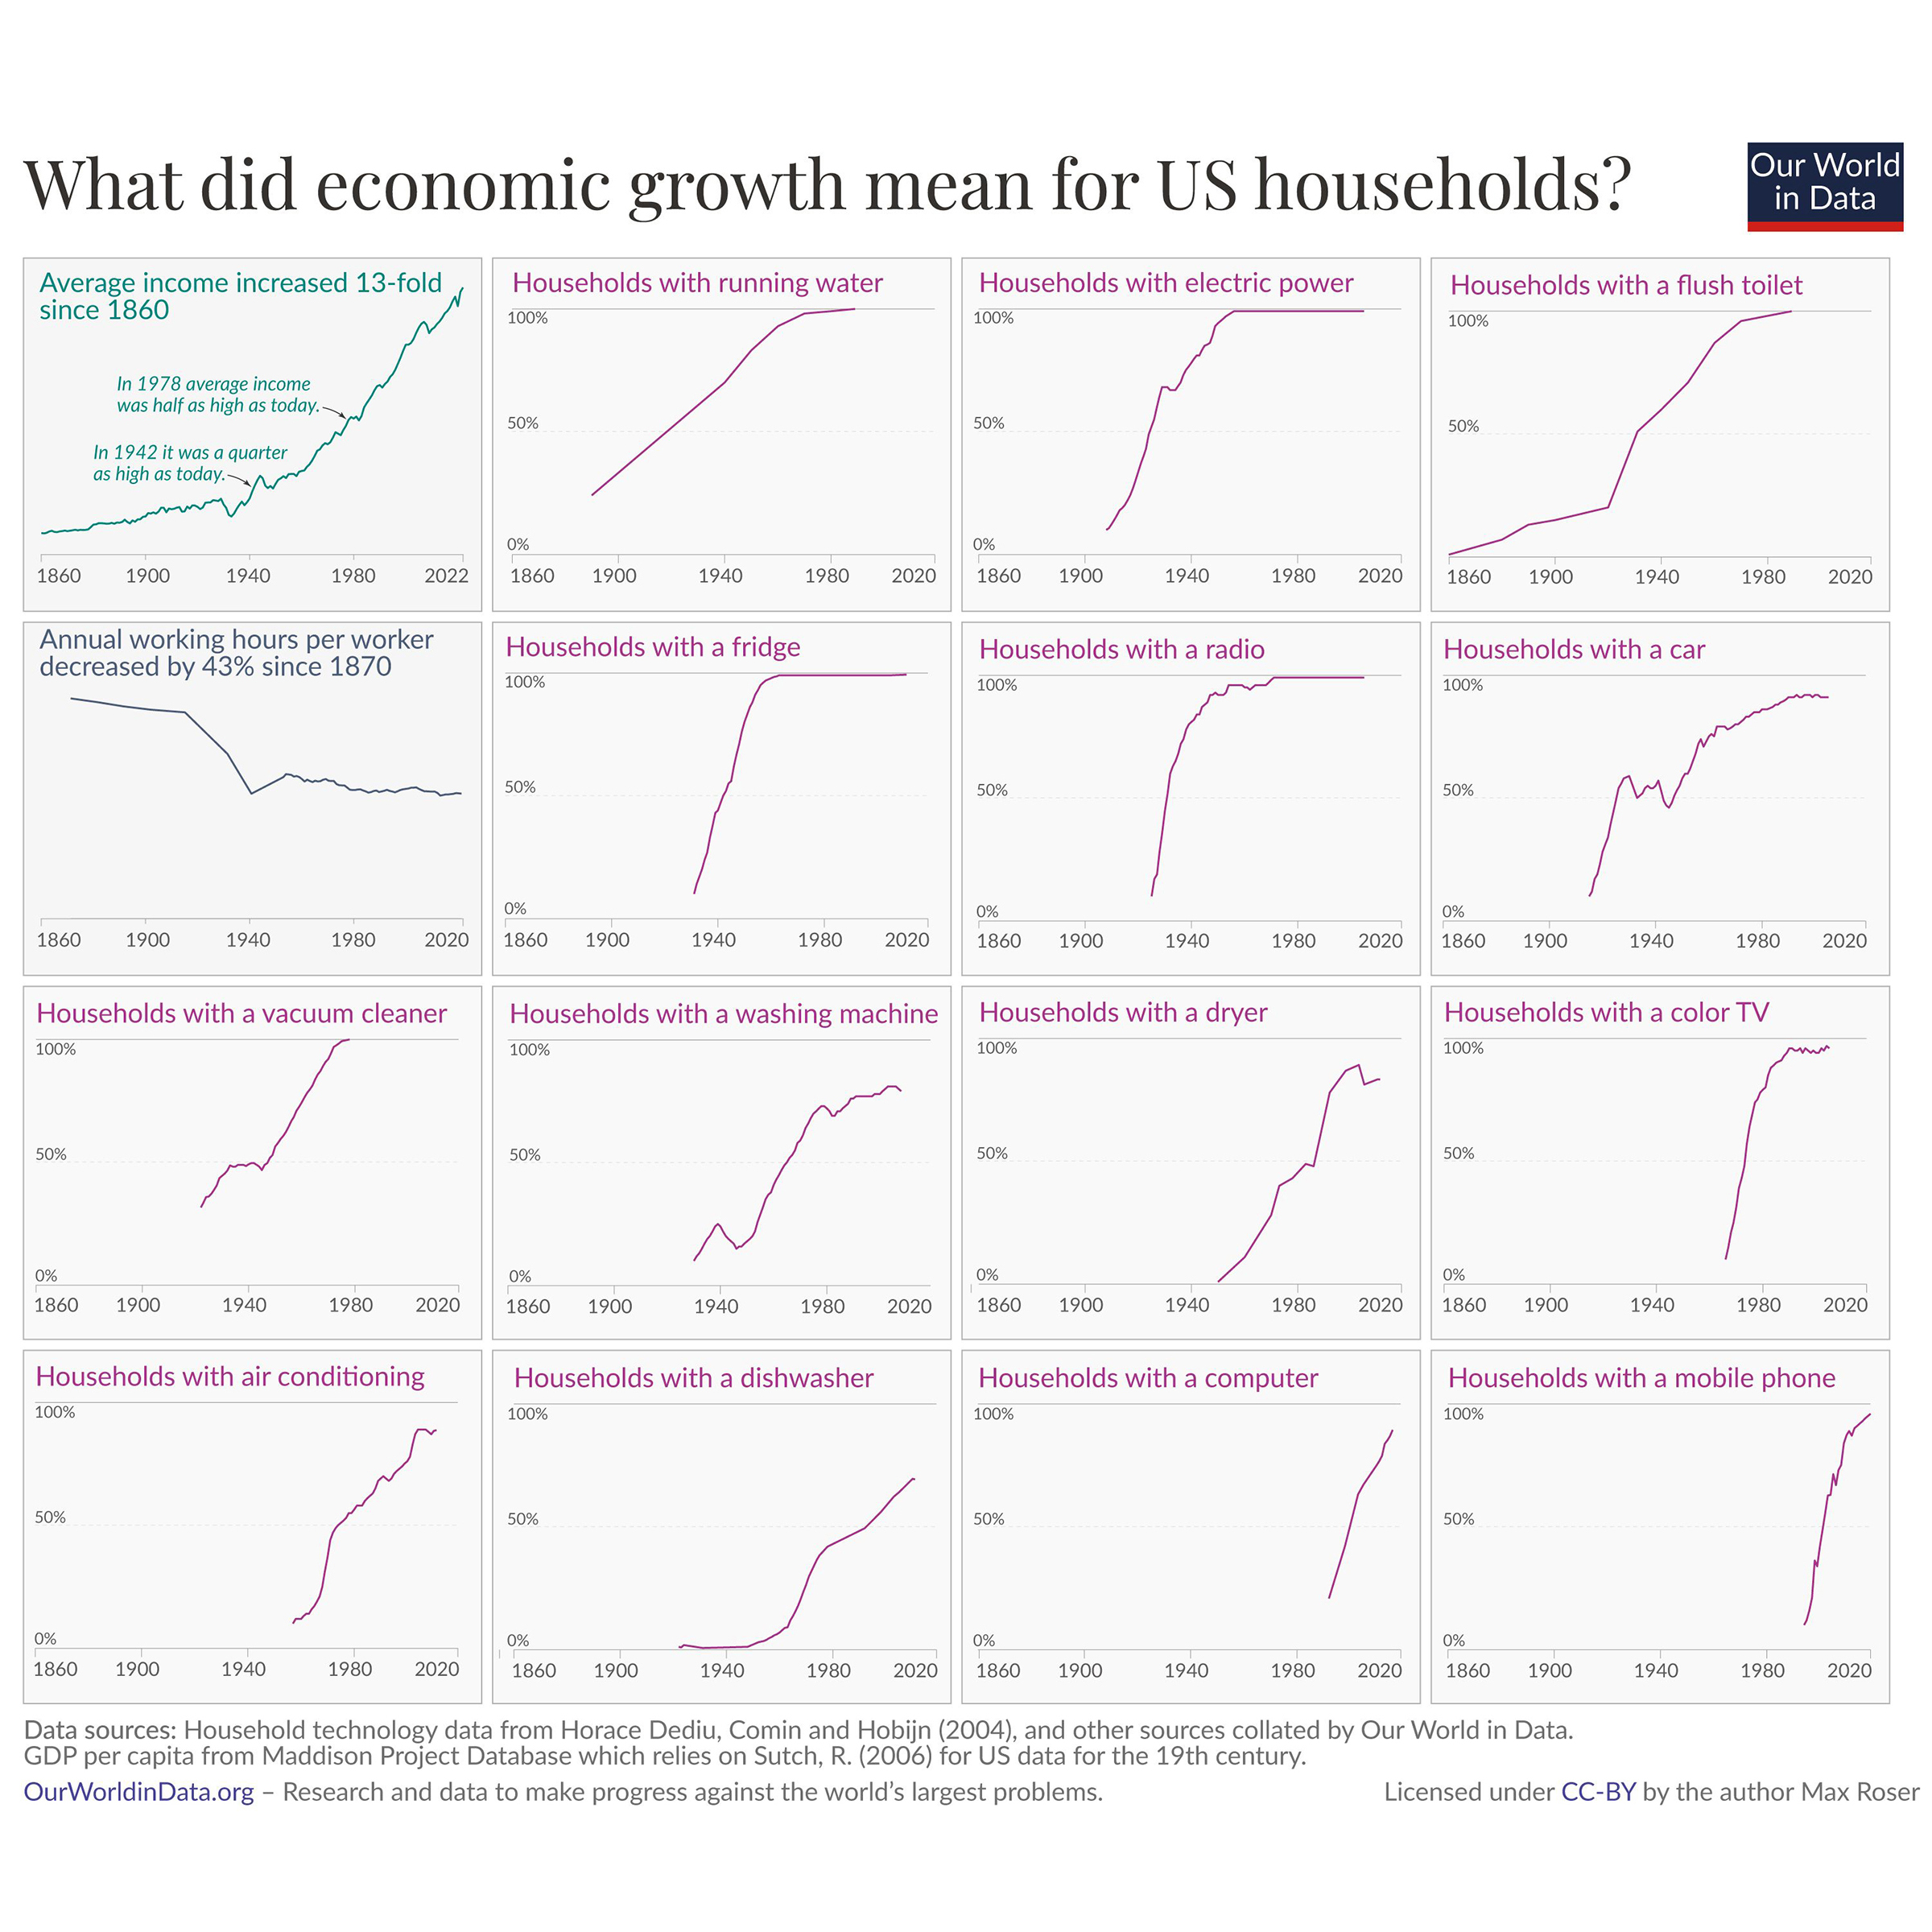
What Did Economic Growth Mean for U.S. Households?
This was originally posted on our Voronoi app. Download the app for free on iOS or Android and discover incredible data‑driven charts from a variety of trusted sources.
- Since 1860, average U.S. income has jumped 13‑fold while annual working hours per worker fell 43%, freeing up both cash and time for new conveniences.
- Tracking who has running water, electricity, or a fridge reveals welfare gains that GDP alone can hide.
- Adoption curves for household tech still offer a quick read on economic progress in emerging markets today.
From indoor plumbing to pocket‑sized computers, the arc of U.S. prosperity can be traced through the everyday items that migrated from luxury to necessity. Examining when households first gained access to these utilities and gadgets reveals how economic growth translates into tangible improvements in daily life—and offers a roadmap for tracking progress in today’s emerging markets.
The visualization above, created by Our World in Data (Max Roser), pairs 160 years of U.S. GDP‑per‑capita data with the share of households that own—or simply have access to—everyday necessities.
From Railroads to Refrigerators: A Century of Catch‑Up
Economic historian Jeremy Greenwood calls household technologies the “engines of liberation” because they turn income into comfort and time‑saving capacity.
Refrigerators and vacuum cleaners, for example, swept into more than 70% of homes within two decades of commercial viability, mirroring the earlier diffusion of running water and electric light. By 1970, the typical American household owned goods that were science fiction just 50 years earlier. Next, computers and mobile phones leapt from niche to mainstream in a single generation, echoing earlier booms in radio and television.
Together, these trends show how higher output translated into tangible improvements inside the home—arguably the place people feel growth most directly.
Beyond GDP: Why Access Matters
Traditional growth metrics like GDP or real wages conceal what economist Angus Deaton terms the “lived experience” of prosperity.
Tracking adoption rates offers a complementary lens: it tells us not just how big the economy is, but how its gains permeate daily life. A flat income series may hide the fact that color TVs or air‑conditioning are suddenly affordable to all. Work by the National Bureau of Economic Research shows that such quality‑adjusted gains mean living standards rise faster than official estimates suggest.
Lessons for Emerging Economies
The U.S. timeline is now a benchmark for catch‑up development. When researchers compare electrification in India or smartphone uptake in Nigeria, they use similar s‑curves to map progress. Because technology costs fall globally, many emerging economies leapfrog stages—adopting mobile phones, for instance, long before landlines ever became universal. Using access indicators therefore paints a richer picture of growth than per‑capita income alone, and it helps policymakers target bottlenecks in infrastructure and affordability.
Learn More on the Voronoi App ![]()
Explore more insights into income inequality and economic growth on the Voronoi app, including how daily incomes have changed across the top 20 economies since 1994.