![]()
See this visualization first on the Voronoi app.
Use This Visualization
Visualizing the World’s Aging Population and Falling Growth Rate
This was originally posted on our Voronoi app. Download the app for free on iOS or Android and discover incredible data-driven charts from a variety of trusted sources.
The global population is undergoing a major demographic shift.
As fertility rates fall and life expectancy rises, average ages are climbing in nearly every country, while population growth is steadily tapering off.
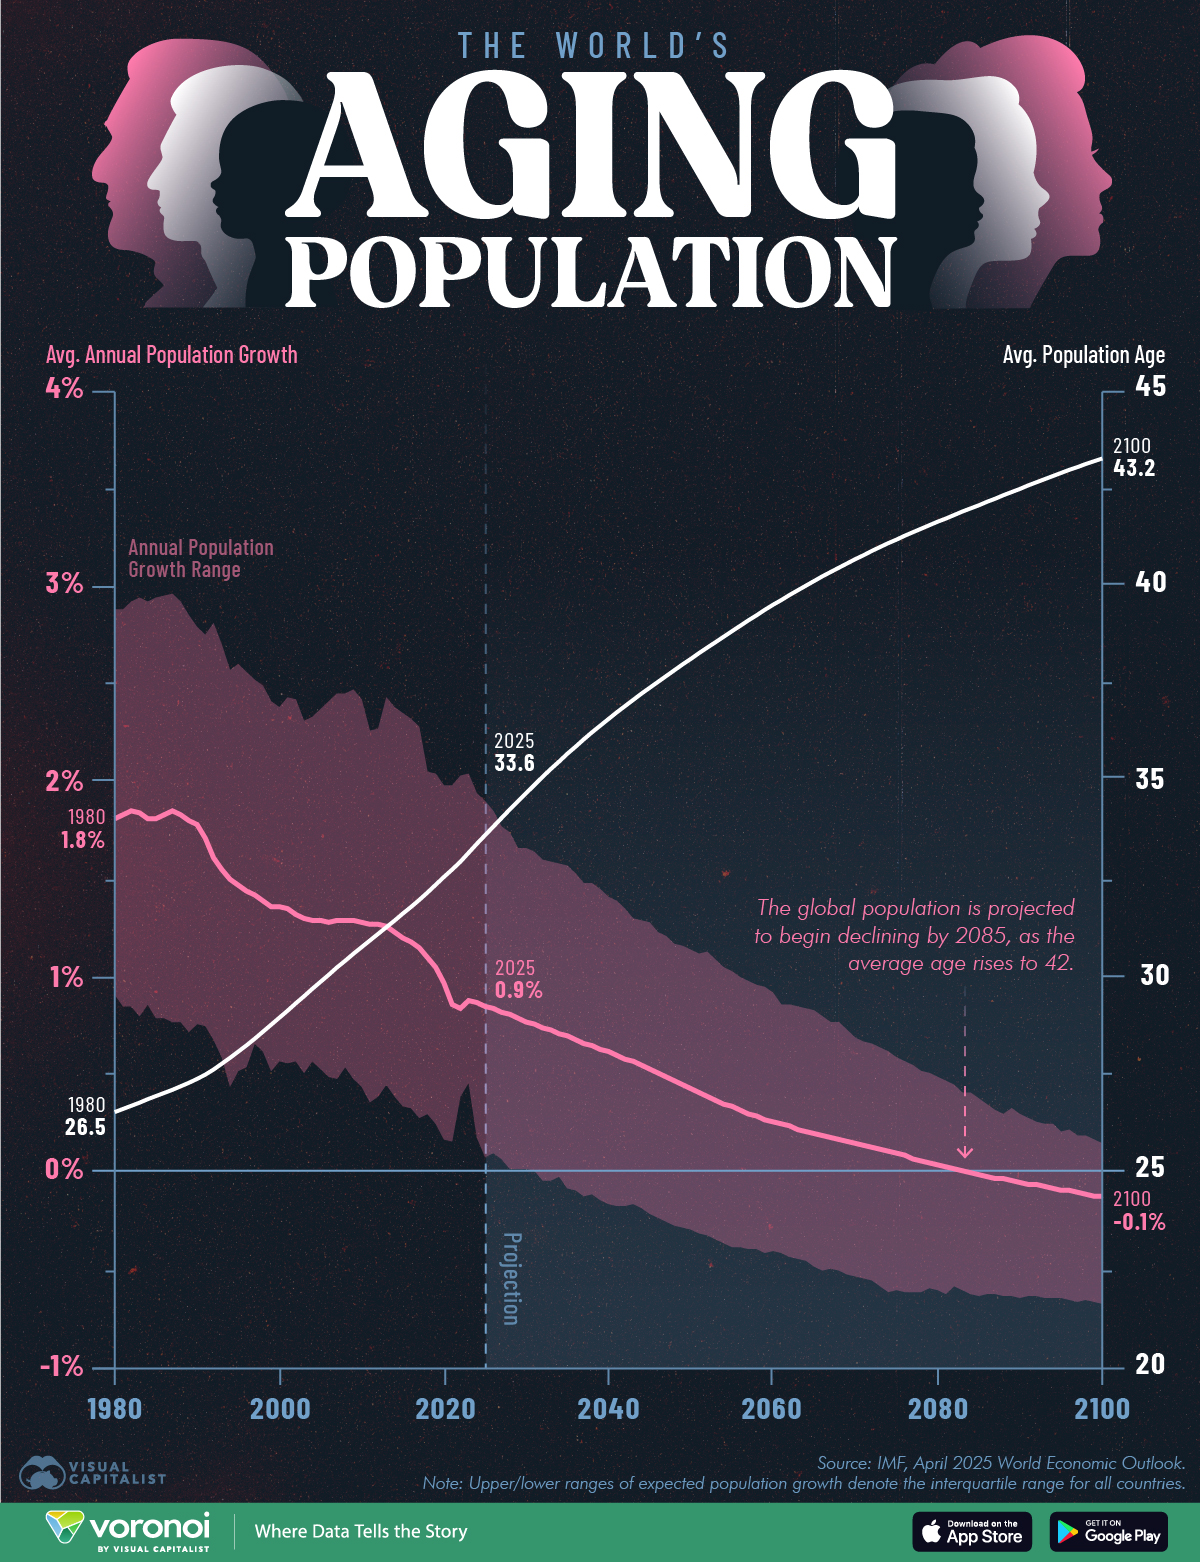
This infographic visualizes global population growth and average age from 1980 to 2100, based on data from the IMF’s World Economic Outlook, April 2025 edition.
How the World Will Age as Population Growth Falls
As of 2025, the average person is 33.6 years old, up from 26.5 years in 1980. Over that same period, global population growth has slowed from 1.8% to 0.9% in 2025.
This trend is expected to continue through the end of the century, as shown in the table below, which breaks down the projected average age and population growth rate from 1980 to 2100:
| Year | Average population growth (%) | Average population age (years) | Lower range of expected population growth (%) | Upper range of expected population growth (%) |
|---|---|---|---|---|
| 1980 | 1.8% | 26.5 | 0.9% | 2.9% |
| 1985 | 1.8% | 26.9 | 0.8% | 2.9% |
| 1990 | 1.8% | 27.3 | 0.8% | 2.8% |
| 1995 | 1.5% | 28.0 | 0.5% | 2.6% |
| 2000 | 1.4% | 28.9 | 0.6% | 2.4% |
| 2005 | 1.3% | 29.8 | 0.5% | 2.4% |
| 2010 | 1.3% | 30.7 | 0.4% | 2.4% |
| 2015 | 1.2% | 31.6 | 0.3% | 2.4% |
| 2020 | 1.0% | 32.5 | 0.2% | 2.0% |
| 2025 | 0.9% | 33.6 | 0.1% | 1.9% |
| 2030 | 0.8% | 34.7 | 0.0% | 1.7% |
| 2035 | 0.7% | 35.7 | -0.1% | 1.6% |
| 2040 | 0.6% | 36.6 | -0.2% | 1.4% |
| 2045 | 0.5% | 37.4 | -0.2% | 1.3% |
| 2050 | 0.4% | 38.1 | -0.3% | 1.1% |
| 2055 | 0.3% | 38.8 | -0.4% | 1.0% |
| 2060 | 0.3% | 39.5 | -0.4% | 0.9% |
| 2065 | 0.2% | 40.1 | -0.5% | 0.8% |
| 2070 | 0.2% | 40.7 | -0.5% | 0.7% |
| 2075 | 0.1% | 41.2 | -0.6% | 0.6% |
| 2080 | 0.0% | 41.6 | -0.6% | 0.5% |
| 2085 | 0.0% | 42.0 | -0.6% | 0.4% |
| 2090 | -0.1% | 42.5 | -0.6% | 0.3% |
| 2095 | -0.1% | 42.9 | -0.6% | 0.2% |
| 2100 | -0.1% | 43.2 | -0.7% | 0.2% |
The global population is projected to begin declining in 2085, as the average age rises to 42 years. By the year 2100, the average person is expected to be 43 years old, with population growth at -0.1%.
However, the trend is divided across countries. Advanced economies like Japan, Germany, and Italy are aging rapidly and seeing population declines. Meanwhile, emerging economies like India still have growing populations, but the growth is slowing down.
The gradual decline is largely due to falling fertility rates globally, along with improvements in healthcare and life expectancy resulting in larger senior populations.
The Impacts of an Aging Population
Many economies are reaching their demographic turning points—when the share of the working-age population in their total population begins declining.
European countries like Germany, France, and Italy crossed this mark pre-2000, and are now among the world’s “super-aged societies”. The United States, the U.K., and China have followed in the last two decades.
But what does this mean for economic growth and the global economy?
Population aging carries several economic challenges. These include shrinking labor forces, slower productivity growth, and increased fiscal pressure on pension and healthcare systems.
However, there is a silver lining: the IMF notes that while people are living longer, they’re also aging more healthfully. This could result in longer working lives and enhance productivity among older workers, potentially easing the economic impacts of an aging population.
Learn More on the Voronoi App ![]()
If you enjoyed this infographic, check out A Visual Breakdown of Where Economic Power Lies in 2025, on the Voronoi app.