Via Dana Lyons' Tumblr,
Assets in mutual funds designed to rise when stocks fall have dropped to an all-time low.
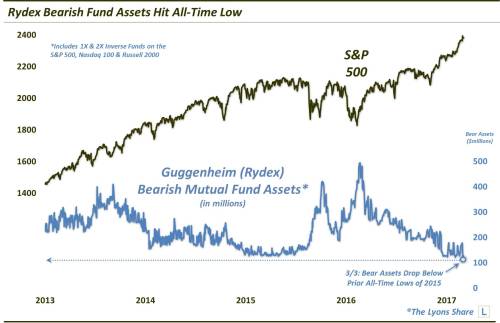
While stock indices have held up (gravity-defyingly) well this year, some potential causes for concern have begun to crop up. Not the least among them is stock market sentiment, i.e., it has become uncomfortably bullish. From survey extremes, like the 30-year high in the Investors Intelligence bullish response to the dearth of hedges across the equity market, collective sentiment is in rarefied air. One example of the latter category can be seen in asset levels at the Guggenheim (formerly Rydex) family of mutual funds – and specifically, in the level of inverse fund assets.
Inverse funds, or bear funds, are of course designed to rise when stocks fall. Rydex originally introduced these funds for active traders to utilize in playing the downside in the stock market, or hedging. Like most sentiment measures, assets in these bear funds typically hit contrary extremes at turning points in the market, i.e., assets soar near market bottoms and plunge at tops. Presently, they are plunging – to all-time lows, in fact. (Note: for purposes of this study, we are using the combined assets of the most popular 1X and 2X inverse S&P 500, Nasdaq 100 and Russell 2000 funds).
Now, as anyone familiar with the topic knows, mutual fund assets, in general, have been in a structural decline for about 10 years coinciding with the proliferation of ETF’s. Even so, the level in bull and bear assets have continued to cycle within shorter time frames with the ebbs and flows of the market.
For example, during the 2015-2016 stock market decline, bearish assets jumped from an all-time low around $126 million near the May 2015 top to nearly $500 near the February 2016 market low. Therefore, while mutual fund assets are in a structural decline, in general, their current all-time low level around $115 million should still be considered an extreme relative to the recent period.
That said, we will say the new low does not automatically suggest the top must be at hand. For one, given the fact that the market is at or near all-time highs, we shouldn’t be surprised that bear assets are at an all-time low. In fact, we should rather expect it. That is how sentiment-based flows work. Furthermore, there is no law saying bearish fund assets can’t go even lower, i.e., the extreme can get more extreme. In that last cycle, bearish assets dropped to a new low in early December 2014 but did not bottom out (along with the stock market top) for another 5 months.
Perhaps the best takeaway of this data point is as a measurement of potential risk. That is how we often like to think of sentiment indicators. In other words, if the stock market were to experience a selloff, how much potential downside might there be? Of course, there are countless factors that go into such a consideration; however, the potential risk based just on this bearish fund asset indicator is substantial. If, for example, assets were to simply mean revert close to that $500, or even $400, million mark, odds are very good that the move would be associated with a significant pullback in stocks. Considering how low assets are now, it would take either a serious and/or extended decline to spur the accumulation of so many bearish fund assets.
In summary, we are not calling for the end of the rally based on this indicator of bearish fund assets. Sentiment is not a timing tool and the indicator can get even more extreme in its scarcity. However, we would consider it a sign of significant potential risk should the market turn lower given the traders’ lack of hedging and ability to withstand much downside currently.
* * *
Like our charts and research? Get an All-Access pass to our complete macro market analysis, every day, at our new site, The Lyons Share .