![]()
See this visualization first on the Voronoi app.

Mapped: Infant Child-Care Costs by State
This was originally posted on our Voronoi app. Download the app for free on iOS or Android and discover incredible data-driven charts from a variety of trusted sources.
Center-based child care costs have been increasing steadily over the past five years, according to recent data from Child Care Aware of America (CCAoA).
The national average annual price of child care in 2023 across all age groups (infants, toddlers, and children over the age of 4) was $11,582—an increase of 3.7% from 2022.
In 2019, about 32% of children under the age of one were enrolled in center-based care, according to the National Center for Education Statistics.
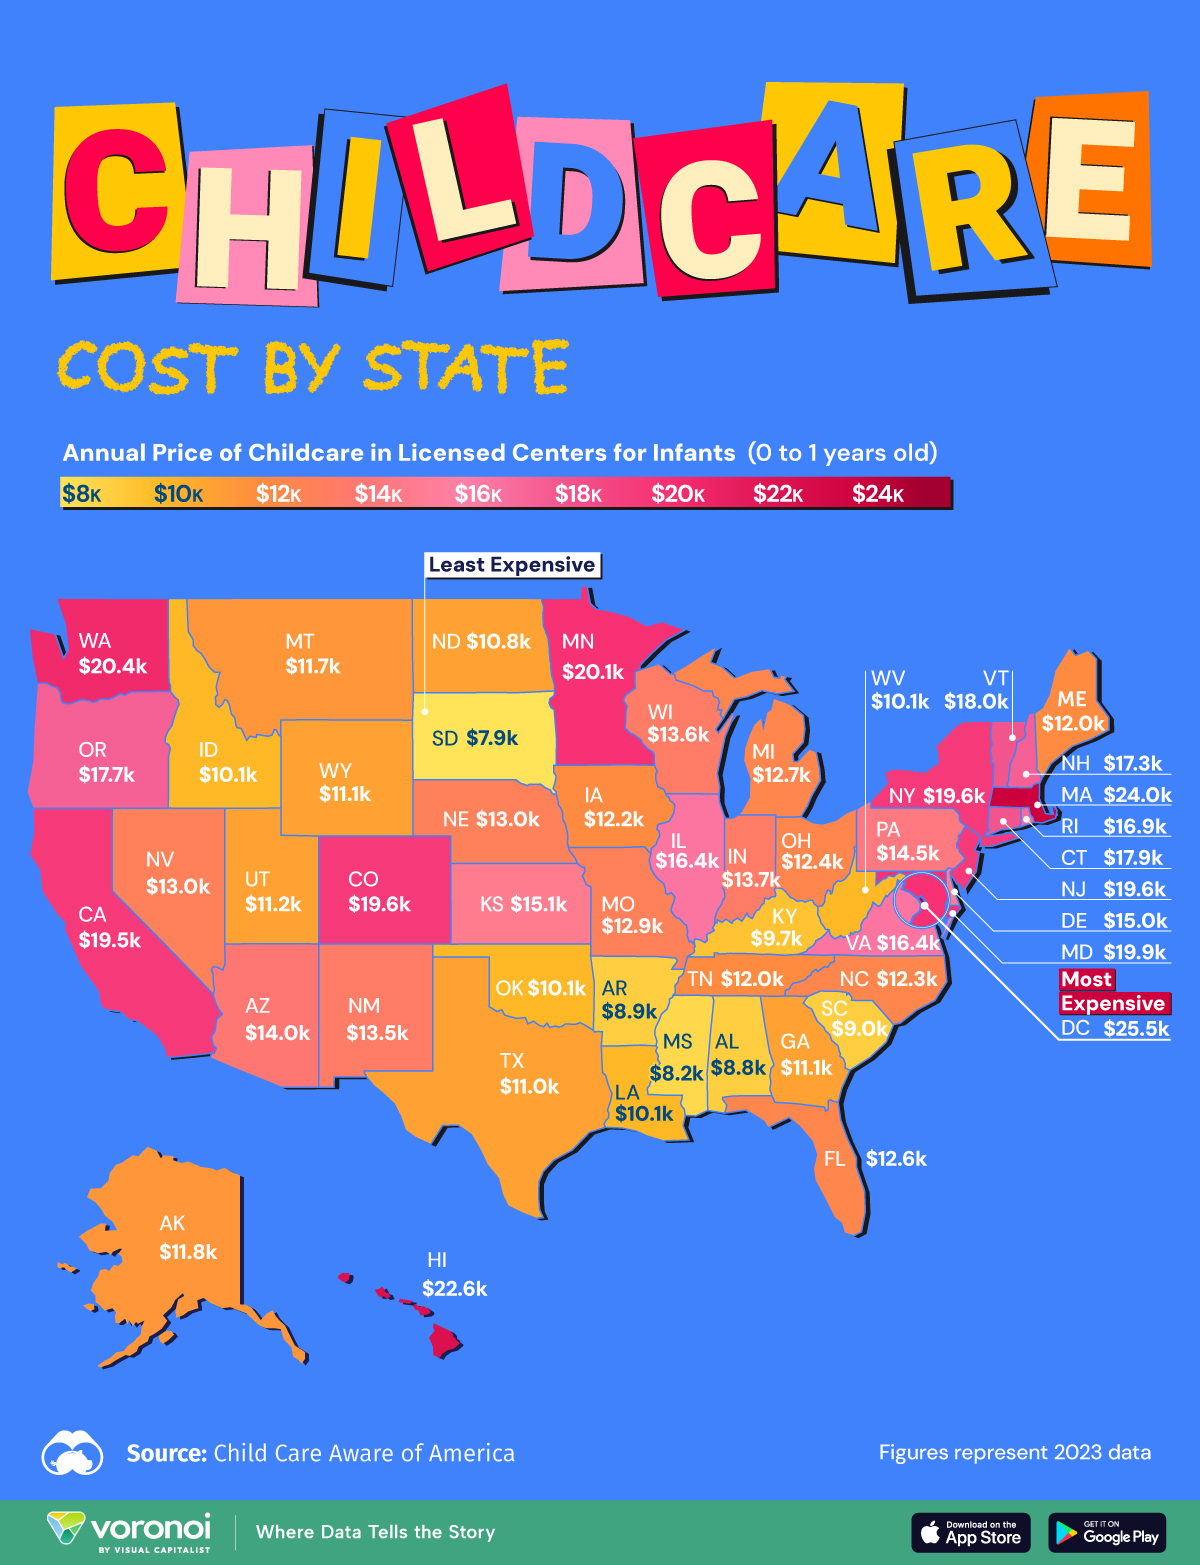
This map shows the average annual price of child care in a licensed care center for infants (0 to 1 years old) by state in 2023, using data from CCAoA’s analysis of child care affordability in the U.S.
Which State Has The Most Expensive Child Care Center for Infants?
Below, we show the average annual price of infant child care in a licensed center by state in 2023.
| State | Average annual cost for infant child care in a licensed center (2023) | % of a married couple's median household income (2023) |
|---|---|---|
| District of Columbia | $25,480 | 10.4% |
| Massachusetts | $24,005 | 14.4% |
| Hawaii | $22,585 | 18.0% |
| Washington | $20,370 | 15.2% |
| Minnesota | $20,129 | 14.5% |
| Maryland | $19,906 | 12.8% |
| New Jersey | $19,634 | 12.5% |
| New York | $19,584 | 14.7% |
| Colorado | $19,573 | 14.9% |
| California | $19,547 | 15.0% |
| Vermont | $17,973 | 14.4% |
| Connecticut | $17,888 | 11.7% |
| Oregon | $17,680 | 14.9% |
| New Hampshire | $17,250 | 11.9% |
| Rhode Island | $16,899 | 13.2% |
| Virginia | $16,397 | 11.8% |
| Illinois | $16,373 | 12.7% |
| Kansas | $15,071 | 13.6% |
| Delaware | $14,995 | 12.0% |
| Pennsylvania | $14,483 | 11.5% |
| Arizona | $14,040 | 12.8% |
| Indiana | $13,736 | 12.7% |
| Wisconsin | $13,572 | 11.2% |
| New Mexico | $13,521 | 14.3% |
| Nevada | $13,024 | 12.6% |
| Nebraska | $13,000 | 11.2% |
| Missouri | $12,907 | 11.6% |
| Michigan | $12,667 | 11.0% |
| Florida | $12,639 | 12.1% |
| Ohio | $12,351 | 10.5% |
| North Carolina | $12,251 | 11.0% |
| lowa | $12,168 | 10.5% |
| Tennessee | $11,985 | 11.5% |
| Maine | $11,960 | 10.5% |
| Alaska | $11,760 | 9.5% |
| Montana | $11,700 | 11.0% |
| Utah | $11,232 | 9.9% |
| Wyoming | $11,075 | 9.8% |
| Georgia | $11,066 | 9.7% |
| Texas | $11,024 | 9.9% |
| North Dakota | $10,758 | 8.7% |
| West Virginia | $10,140 | 10.6% |
| Idaho | $10,108 | 10.2% |
| Louisiana | $10,101 | 9.1% |
| Oklahoma | $10,065 | 10.4% |
| Kentucky | $9,685 | 9.4% |
| South Carolina | $9,048 | 8.5% |
| Arkansas | $8,869 | 9.4% |
| Alabama | $8,771 | 8.4% |
| Mississippi | $8,186 | 8.5% |
| South Dakota | $7,862 | 7.1% |
The nation’s capital, D.C., recorded the highest average annual cost for infant child care at $25,585. However, Hawaii was the most unaffordable state when factoring in median incomes.
On average, paying for infant childcare in a licensed center in Hawaii would make up 18% of a married couple’s median family income in 2023. The national average ($11,582) is about 10% of a typical U.S. married couple’s median income.
Hawaii consistently ranks first among all states for the highest cost of living. Washington, D.C. also ranks among the most expensive metropolitan areas to raise a child.
The U.S. Department of Health and Human Services recommended that child care should not cost families more than 7% of their annual income. According to CCAoA, in every single state in the U.S. in 2023, infant child care made up more than 7% of the median married couple’s income in the state.
South Dakota recorded the lowest infant child care cost at $7,862 per year, making up 7.1% of a married couple’s income.
Learn More on the Voronoi App
To learn more about affordability in the U.S., check out this graphic that show the top 10 states with the highest cost of living.
The post Mapped: Infant Child-Care Costs by U.S. State appeared first on Visual Capitalist.