![]()
See this visualization first on the Voronoi app.
Use This Visualization
Visualizing The S&P 500’s Domestic and Foreign Revenues
This was originally posted on our Voronoi app. Download the app for free on iOS or Android and discover incredible data-driven charts from a variety of trusted sources.
As tariffs remain top of mind ahead of the upcoming U.S. election, some American industries may be more vulnerable to price fluctuations stemming from these trade policies.
Sectors reliant on foreign revenue are particularly vulnerable to the potential impact of stricter tariffs—a policy that Republican presidential candidate Donald Trump has consistently proposed.
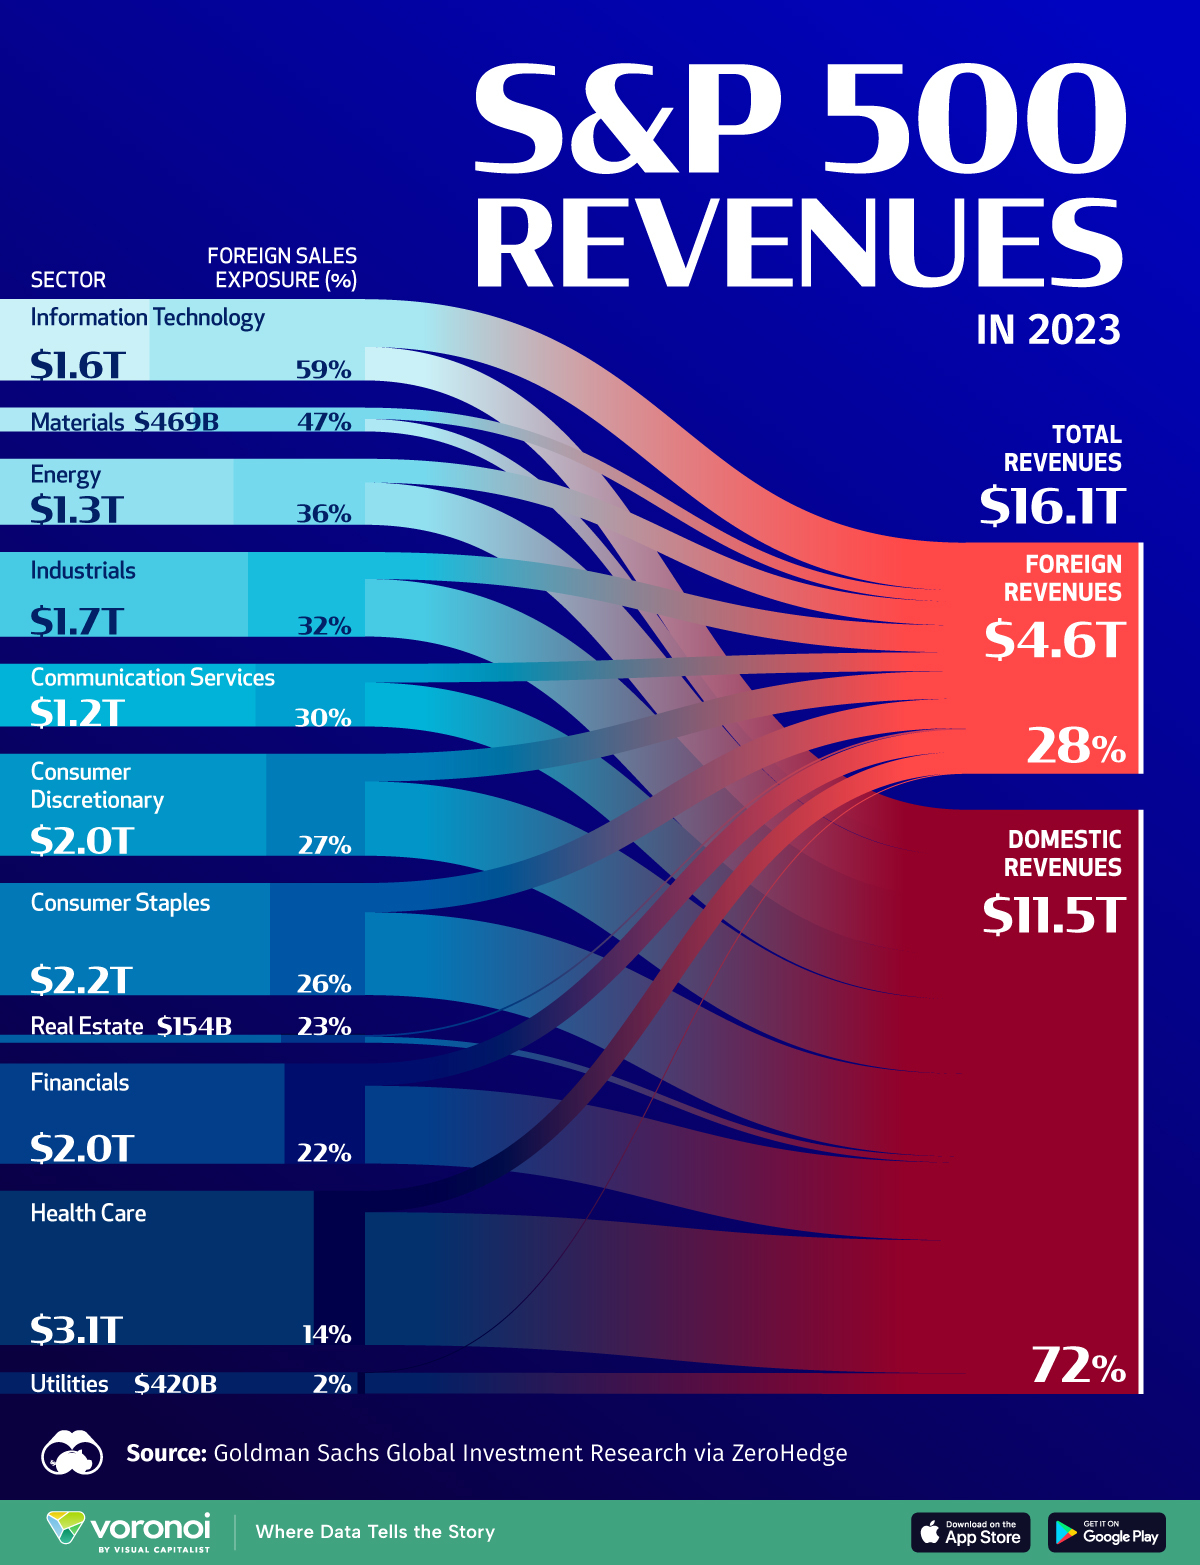
This chart visualizes the share of S&P 500’s revenues that come from foreign and domestic sales, broken down by sector.
The data comes from a Goldman Sachs report via ZeroHedge and is updated as of June 2024.
How Much S&P 500 Revenues Come From Foreign Sources
Below, we show the breakdown of the S&P 500’s revenue between domestic and foreign sources in 2023.
| Sector | Total Revenues ($bn) | Foreign Revenues ($bn) | Foreign Sales Exposure (%) | Explicit Emerging Market (EM) Sales Exposure (%) |
|---|---|---|---|---|
| Information Technology | $1,601 | $942 | 59% | 17% |
| Materials | $469 | $221 | 47% | 12% |
| Energy | $1,301 | $469 | 36% | 3% |
| Industrials | $1,666 | $531 | 32% | 5% |
| Communication Services | $1,236 | $369 | 30% | 2% |
| Consumer Discretionary | $2,011 | $546 | 27% | 3% |
| Consumer Staples | $2,211 | $576 | 26% | 3% |
| Real Estate | $154 | $36 | 23% | 3% |
| Financials | $1,973 | $437 | 22% | 1% |
| Health Care | $3,039 | $419 | 14% | 1% |
| Utilities | $420 | $10 | 2% | 2% |
| S&P 500 | $16,082 | $4,556 | 28% | 4% |
While foreign revenues made up just 28% of the S&P 500’s revenues in 2023, some sectors are more exposed to foreign sales than others.
The S&P 500’s information technology sector had the largest exposure to foreign sales, with 59% of its revenue coming from foreign sources–more than double the index’s average. The index’s information technology category includes big tech firms such as Apple, Nvidia, and Microsoft.
The IT sector of the S&P 500 is highly exposed to foreign sales primarily due to the global nature of technology businesses, which allows for easy distribution of digital products and services worldwide, and the pursuit of large international markets for growth opportunities.
This exposure is further amplified by the sector’s complex global supply chains and the inherent scalability of many tech offerings.
The materials sector is the second most exposed sector to foreign sales, and is made up of mining, chemicals, and forest product companies.
Looking at emerging market sales exposure specifically, the information technology sector is again the most exposed.
Learn More on the Voronoi App
To learn more about the S&P 500’s performance, check out this graphic that shows how the index fares after an interest rate cut.
The post Visualizing The S&P 500’s Domestic and Foreign Revenues appeared first on Visual Capitalist.