![]()
See this visualization first on the Voronoi app.
Use This Visualization
Explainer: How Hurricane Categories Work
This was originally posted on our Voronoi app. Download the app for free on iOS or Android and discover incredible data-driven charts from a variety of trusted sources.
Hurricane Milton made landfall in Florida as a Category 3 hurricane, and exited the area as a Category 1 storm. What do these hurricane categories mean?
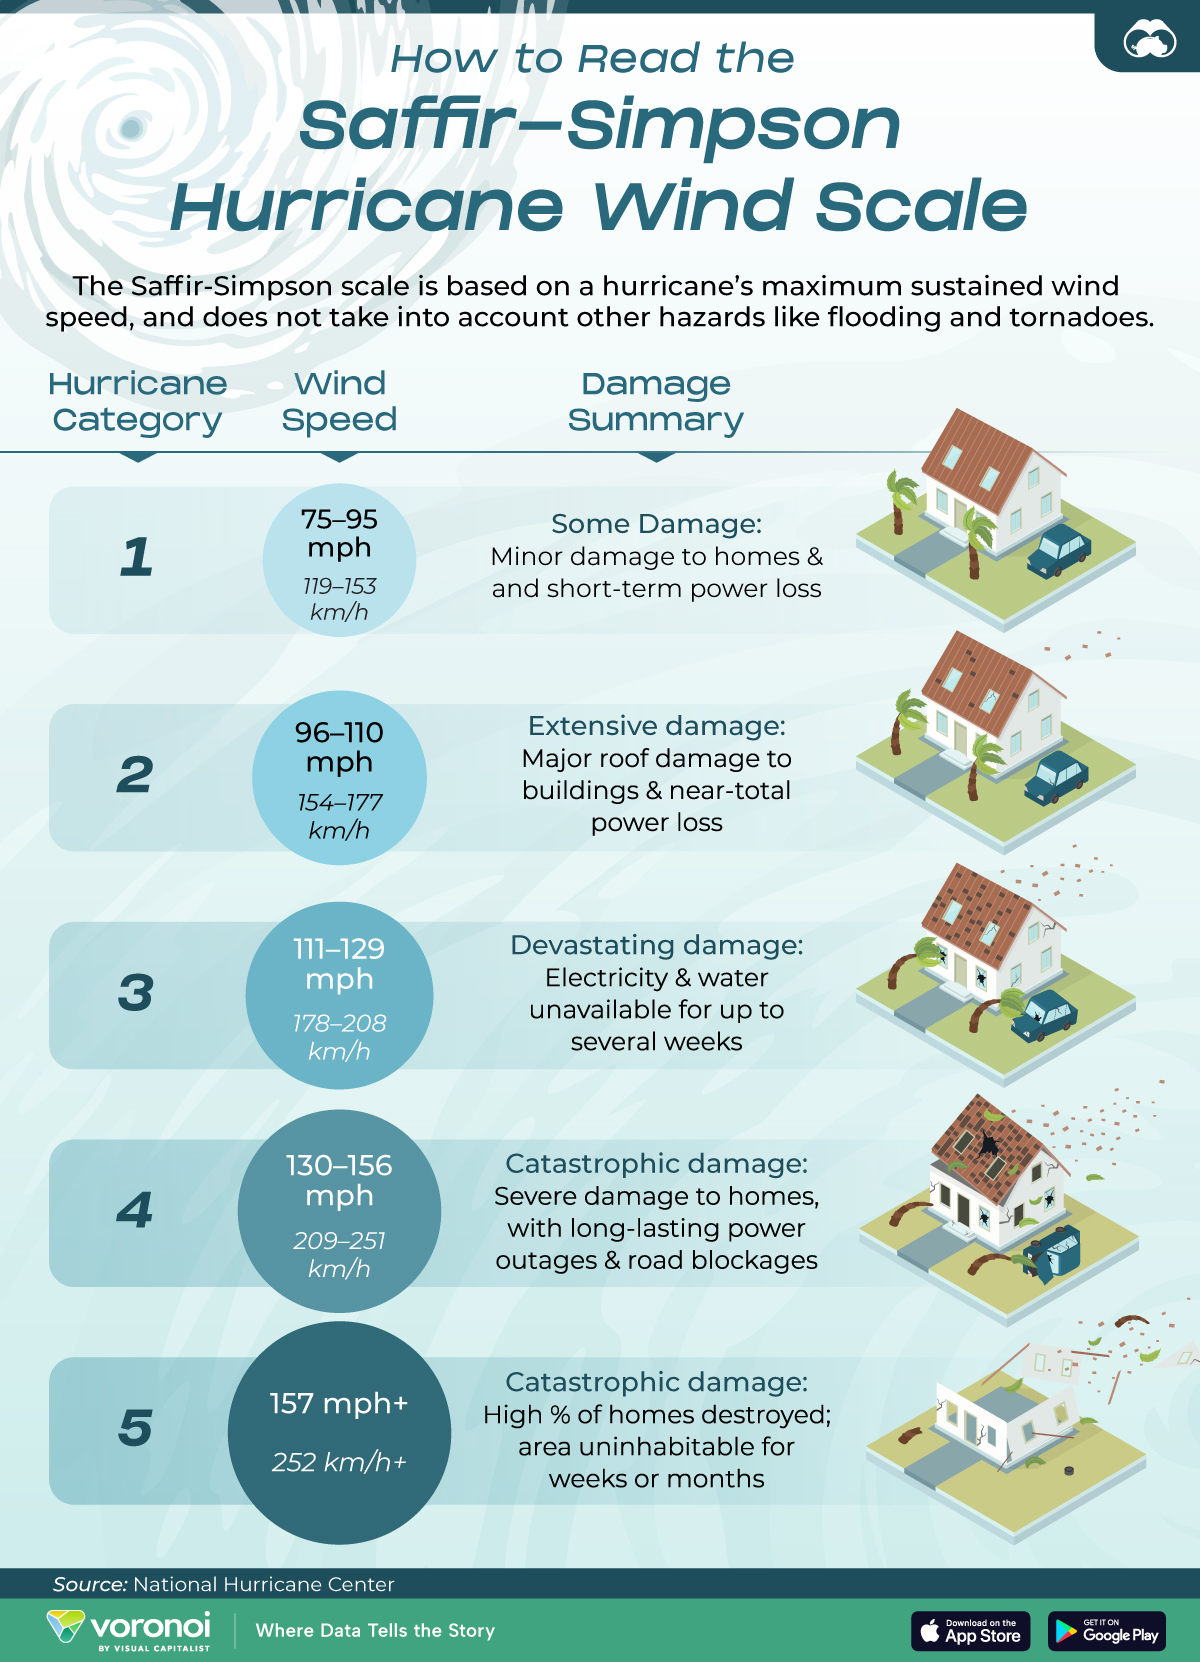
We visualize the Saffir-Simpson Hurricane Wind Scale, which measures maximum sustained wind speed for one minute to estimate likely property damage.
Data is sourced from the Hurricane Center at National Oceanic and Atmospheric Administration.
Importantly it does not take into account other related weather conditions from a hurricane: storm surges (tsunami-like phenomenon of rising water), flooding, and tornadoes.
Hurricane Categories Measure Wind Speeds
At the very lowest rung, even a Category 1 storm (74-95 mph winds) can cause significant damage—broken roofs, bent gutters, snapped branches, and toppled trees, especially those with shallow roots.
As the wind speed gets higher, the damage potential worsens, as seen in the table below.
| Category | Maximum Sustained Winds (1 Minute) |
KMPH Equivalent | Description |
|---|---|---|---|
| 1 | 74-95 mph | 119-153 km/h | Minor damage to homes and short term power loss |
| 2 | 96-110 mph | 154-177 km/h | Major roof damage to buildings and near-total power loss |
| 3 | 111-129 mph | 178-208 km/h | Electricity and water unavailable for up to several weeks |
| 4 | 130-156 mph | 209-251 km/h | Severe damage to homes, with long lasting power outages and road blockages |
| 5 | 157 mph or higher | 252 km/h or higher | High % of homes destroyed; area uninhabitable for weeks or months |
However, hurricanes often weaken as they approach land due to friction with the surface and reduced access to the warm ocean waters that fuel them.
For example, Hurricane Katrina strengthened into a Category 5 over the waters of the Gulf of Mexico, but reduced to a Category 3 upon landfall. And as stated above, Milton lost wind speed after it moved through the Floridian west coast.
And all of this is still measuring only wind damage. Often the majority of destruction occurs after storm surges and flooding.
In fact there has been discussion regarding a separate storm surge scale to help forecasting. However, local underwater topography has an outsized role in determining the impact of a storm surge, rendering any one scale inefficient.
Learn More on the Voronoi App ![]()
Despite being a category 3, Hurricane Katrina ranks first by the damage costs, leapfrogging other more severe storms. Check out The Costliest Hurricanes to Hit the U.S. for more information.
The post Explained: How Hurricane Categories Work in One Chart appeared first on Visual Capitalist.