![]()
See this visualization first on the Voronoi app.

Use This Visualization
Which MLB Teams Take Home the Most Revenue?
This was originally posted on our Voronoi app. Download the app for free on iOS or Android and discover incredible data-driven charts from a variety of trusted sources.
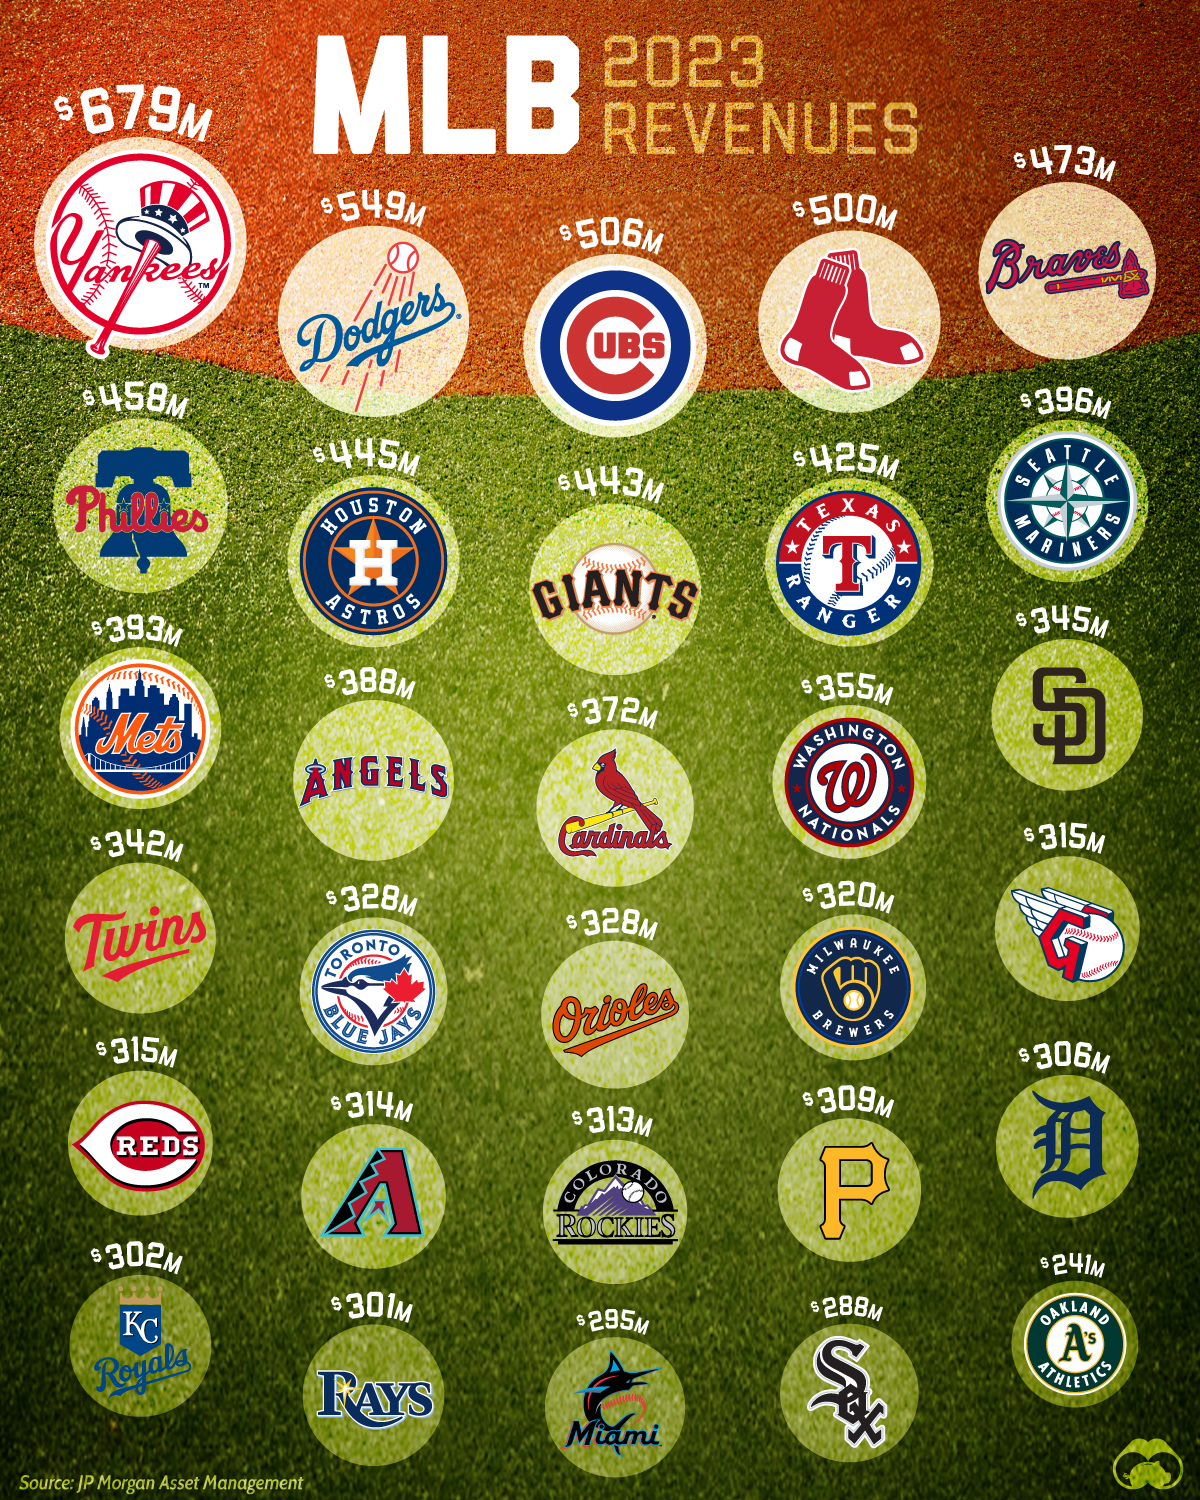
Last year, MLB teams earned an average of $378 million in revenue, as total league revenues surged at the fastest rate since 2015.
Fueling this growth were record sales across various revenue streams, including tickets, merchandise, licensing, and broadcasting rights. In 2024, TV deals are expected to generate $1.8 billion for the season. The MLB is one of the few U.S. leagues without salary caps, where player costs typically account for 50% of team revenues.
This graphic shows the revenue of every MLB team in 2023, based on data from JP Morgan Asset Management.
The Richest MLB Teams by Revenue
Below, we show each MLB team by revenue and valuation:
| Rank | MLB Team | 2023 Revenue | Valuation |
|---|---|---|---|
| 1 | New York Yankees | $679M | $7.6B |
| 2 | Los Angeles Dodgers | $549M | $5.5B |
| 3 | Chicago Cubs | $506M | $4.2B |
| 4 | Boston Red Sox | $500M | $4.5B |
| 5 | Atlanta Braves | $473M | $2.8B |
| 6 | Philadelphia Phillies | $458M | $2.9B |
| 7 | Houston Astros | $445M | $2.4B |
| 8 | San Francisco Giants | $443M | $3.8B |
| 9 | Texas Rangers | $425M | $2.4B |
| 10 | Seattle Mariners | $396M | $2.2B |
| 11 | New York Mets | $393M | $3.0B |
| 12 | Los Angeles Angels | $388M | $2.7B |
| 13 | St Louis Cardinals | $372M | $2.6B |
| 14 | Washington Nationals | $355M | $2.0B |
| 15 | San Diego Padres | $345M | $1.8B |
| 16 | Minnesota Twins | $342M | $1.5B |
| 17 | Toronto Blue Jays | $328M | $2.1B |
| 18 | Baltimore Orioles | $328M | $1.7B |
| 19 | Milwaukee Brewers | $320M | $1.6B |
| 20 | Cleveland Guardians | $315M | $1.4B |
| 21 | Cincinnati Reds | $315M | $1.3B |
| 22 | Arizona Diamondbacks | $314M | $1.4B |
| 23 | Colorado Rockies | $313M | $1.5B |
| 24 | Pittsburgh Pirates | $309M | $1.3B |
| 25 | Detroit Tigers | $306M | $1.5B |
| 26 | Kansas City Royals | $302M | $1.2B |
| 27 | Tampa Bay Rays | $301M | $1.3B |
| 28 | Miami Marlins | $295M | $1.0B |
| 29 | Chicago White Sox | $288M | $2.1B |
| 30 | Oakland Athletics | $241M | $1.2B |
Today, the New York Yankees are the most valuable MLB team at $7.6 billion, with 2023 revenues of $679 million.
Over the past decade, their valuation has grown by an average of 14% annually. Boosting revenues are sponsorship deals, including the biggest patch deal with Star Insurance in the league’s history. Notably, the deal is valued at roughly $25 million per year until 2031. Ticket sales, while totaling $279 million last season, dropped from $345 million in 2022.
Overall, the MLB earns the most stadium revenue across major U.S. sports leagues, at $1.1 billion in 2022, surpassing the NFL by $200 million.
The Los Angeles Dodgers rank second, generating $549 million in revenue. Their 2023 season saw the highest attendance in the league, drawing nearly 3.9 million fans. In 2024, they continue to grow the brand thanks in part to the star power of Shohei Ohtani.
Next are the Boston Red Sox, who secured a $170 million jersey patch deal over 10 years with MassMutual. Despite missing the playoffs since their 2018 championship win, the team’s valuation has risen by 12% annually over the last decade.
Overall, the New York Mets were the least profitable across teams last year, with a net operating loss of $292 million. By contrast, the Baltimore Orioles generated the highest profit, at $99 million, seeing among the strongest five-year revenue growth across the league.
Learn More on the Voronoi App
To learn more about this topic from a football perspective, check out this graphic on the top NFL teams by revenue.
The post Which MLB Teams Take Home the Most Revenue? appeared first on Visual Capitalist.