![]()
See this visualization first on the Voronoi app.
Use This Visualization
Charted: Startups the Key to U.S. Job Growth
This was originally posted on our Voronoi app. Download the app for free on iOS or Android and discover incredible data-driven charts from a variety of trusted sources.
Who is really creating jobs in the economy? And what does a business’s maturity have to do with that job growth?
Turns out there is some data to shed some insights.
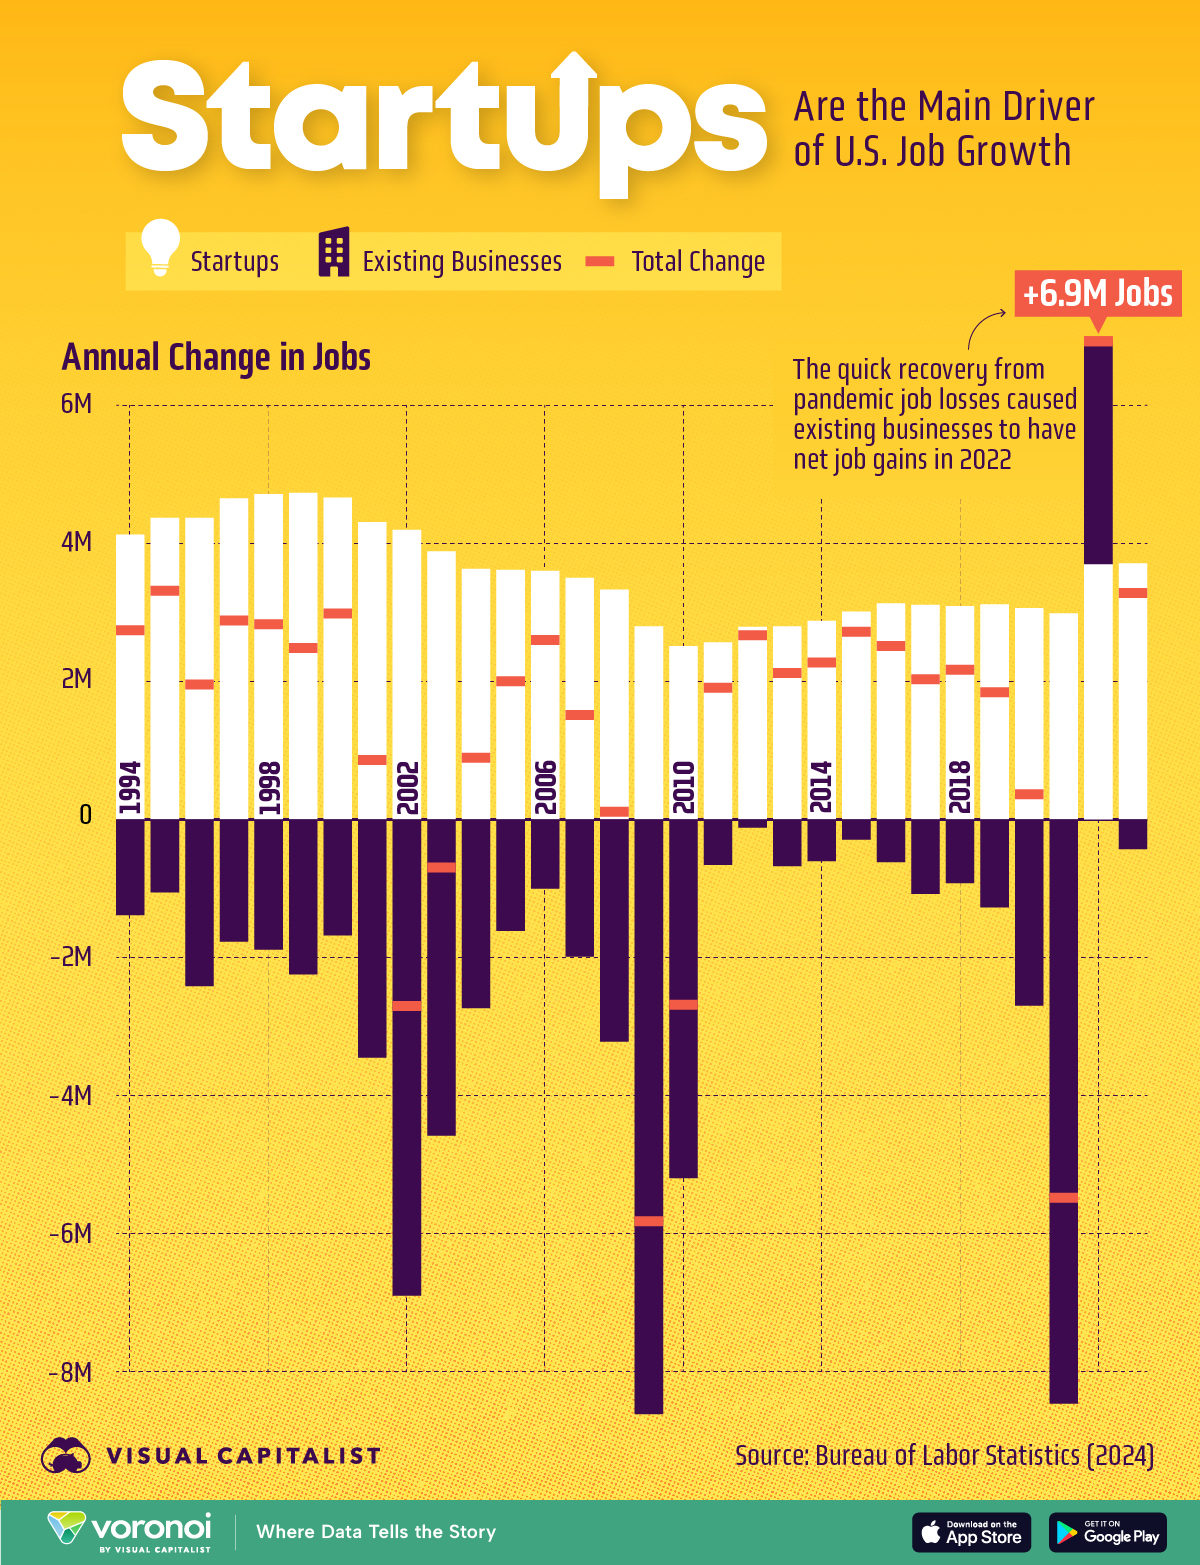
This chart tracks net employment gains in the U.S. by startups and established businesses. Figures are sourced from the Bureau of Labor Statistics (BLS), published January 2024.
The source defines startups as firms that are less than 1 year old.
America’s Entrepreneurs Keep the Job Market Ticking
Startups, by definition, are job creators in the economy as they add more jobs than they cut in their first year.
| Year | New jobs at startups (thousands) | New jobs at existing businesses (thousands) | Overall Net (thousands) |
|---|---|---|---|
| 1994 | 4,127 | -1,386 | 2,741 |
| 1995 | 4,371 | -1,057 | 3,314 |
| 1996 | 4,370 | -2,413 | 1,957 |
| 1997 | 4,651 | -1,768 | 2,883 |
| 1998 | 4,714 | -1,886 | 2,828 |
| 1999 | 4,731 | -2,246 | 2,485 |
| 2000 | 4,664 | -1,679 | 2,985 |
| 2001 | 4,309 | -3,449 | 860 |
| 2002 | 4,196 | -6,900 | -2,704 |
| 2003 | 3,884 | -4,581 | -697 |
| 2004 | 3,630 | -2,734 | 896 |
| 2005 | 3,618 | -1,615 | 2,003 |
| 2006 | 3,603 | -1,001 | 2,602 |
| 2007 | 3,502 | -1,987 | 1,515 |
| 2008 | 3,330 | -3,218 | 112 |
| 2009 | 2,797 | -8,617 | -5,820 |
| 2010 | 2,510 | -5,195 | -2,685 |
| 2011 | 2,567 | -659 | 1,908 |
| 2012 | 2,789 | -119 | 2,670 |
| 2013 | 2,798 | -677 | 2,121 |
| 2014 | 2,878 | -604 | 2,274 |
| 2015 | 3,011 | -292 | 2,719 |
| 2016 | 3,131 | -619 | 2,512 |
| 2017 | 3,111 | -1,079 | 2,032 |
| 2018 | 3,091 | -923 | 2,168 |
| 2019 | 3,117 | -1,272 | 1,845 |
| 2020 | 3,063 | -2,696 | 367 |
| 2021 | 2,985 | -8,464 | -5,479 |
| 2022 | 3,698 | 3,231 | 6,929 |
| 2023 | 3,711 | -428 | 3,283 |
On the other hand, older businesses tend to cut more jobs than they add even when accounting for expanding operations.
In the nearly 20 years that the BLS has been tracking this, there has been only one exception to this rule. This was in 2022, when even existing businesses added more jobs in the economy than they cut.
Of course this followed cutting over 8 million jobs in 2021, so the job creation didn’t quite even out.
Americans Have Caught the Entrepreneurship Bug
Another thing that’s come out of the pandemic is how entrepreneurship has taken a hold on the American psyche.
When looking at new business applications, there has been a sustained trend of more than 400,000 filed every month since the pandemic hit.
This is double the average pre-pandemic rate, and has continued all the way until the end of last year.
Learn More on the Voronoi App ![]()
Just starting a new business doesn’t automatically lead to lasting jobs in the economy of course. Check out: The Survival Rate of U.S. Businesses Born in 2013 to see what percentage of them made it till 2023.
The post Charted: Startups the Key to U.S. Job Growth appeared first on Visual Capitalist.