![]()
See this visualization first on the Voronoi app.
Use This Visualization
Visualizing the Interest Rates of U.S. Treasurys (2020-2025)
This was originally posted on our Voronoi app. Download the app for free on iOS or Android and discover incredible data-driven charts from a variety of trusted sources.
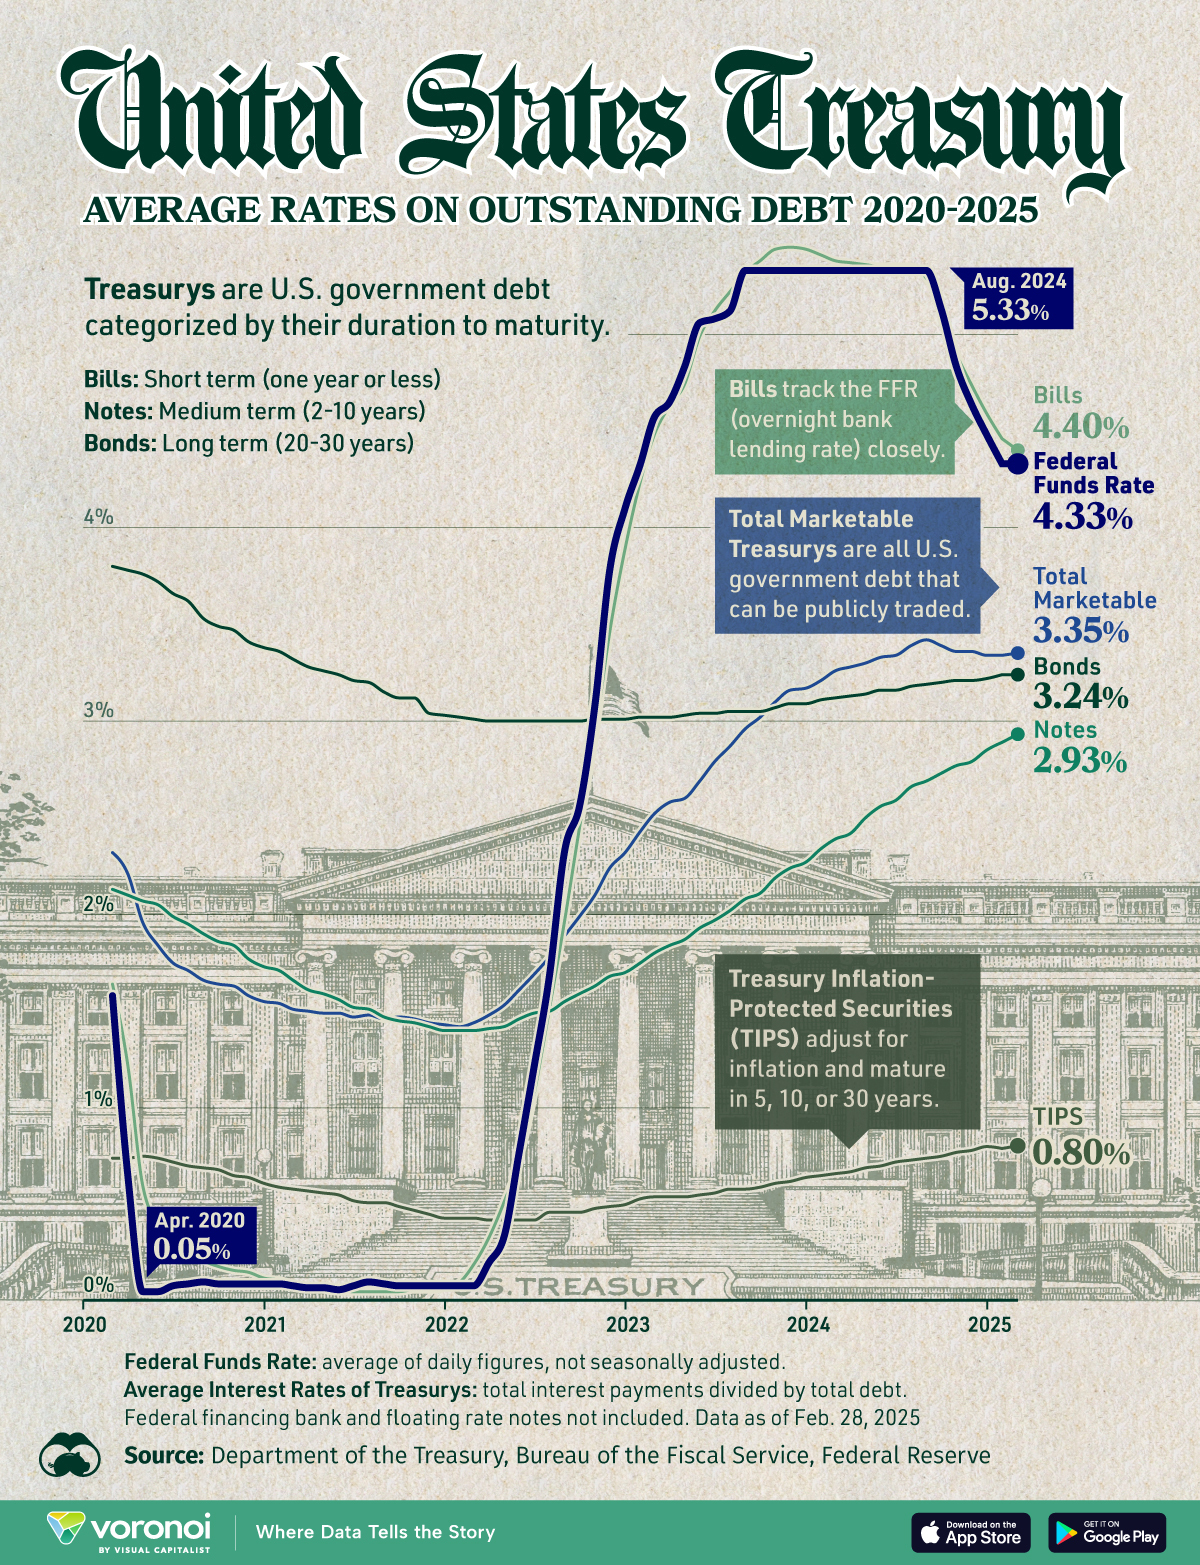
U.S. government borrowing costs have climbed in recent years, with the average rate on marketable Treasury debt reaching 3.35% in early 2025.
This visualization shows the average interest rates of U.S. treasurys from February 2020 to February 2025, as well as the federal funds rate.
The data comes from the Department of the Treasury and the Federal Reserve and is updated as of Feb. 28, 2025.
The average interest rates of the treasurys is the total interest payments divided by total debt. Federal financing bank and floating rate notes are not included.
The federal funds rate is the average of daily figures, and not seasonally adjusted.
Which U.S. Treasury Has the Highest Yield?
Below, we show the average interest rates of each treasury, as well as the federal interest rate, from February 2020 to February 2025.
| Date | Total Marketable | Bills | Bonds | TIPS | Notes | Federal interest rate |
|---|---|---|---|---|---|---|
| 2020-02-29 | 2.32 | 1.64 | 3.80 | 0.74 | 2.13 | 1.58 |
| 2020-06-30 | 1.75 | 0.33 | 3.66 | 0.72 | 1.99 | 0.08 |
| 2021-01-31 | 1.54 | 0.11 | 3.36 | 0.59 | 1.71 | 0.09 |
| 2021-06-30 | 1.47 | 0.05 | 3.21 | 0.52 | 1.52 | 0.08 |
| 2022-01-31 | 1.42 | 0.10 | 3.02 | 0.43 | 1.40 | 0.08 |
| 2022-06-30 | 1.69 | 1.07 | 3.00 | 0.42 | 1.49 | 1.21 |
| 2023-01-31 | 2.43 | 4.24 | 3.02 | 0.53 | 1.75 | 4.33 |
| 2023-06-30 | 2.79 | 5.12 | 3.04 | 0.56 | 1.97 | 5.08 |
| 2024-01-31 | 3.21 | 5.41 | 3.11 | 0.65 | 2.34 | 5.33 |
| 2024-06-30 | 3.34 | 5.35 | 3.16 | 0.72 | 2.59 | 5.33 |
| 2025-01-31 | 3.34 | 4.46 | 3.24 | 0.79 | 2.89 | 4.33 |
| 2025-02-28 | 3.35 | 4.40 | 3.24 | 0.80 | 2.93 |
The average rate on total marketable U.S. government debt rose to 3.35% in 2025. This increase comes as the Federal Reserve has maintained higher interest rates to combat inflation, influencing yields across different types of U.S. Treasury securities.
Treasury bills (short-term debt) had the highest yield during this period, closely tracking the federal interest rate at 4.40% in early 2025.
The Fed’s rate hikes, which began in 2022 to curb inflation, significantly impacted short-term borrowing costs, pushing Treasury bill (T-bill) yields to a high of 5.45% in late 2023.
The rise in Treasury yields has increased the cost of servicing U.S. government debt. Higher rates mean that new borrowing and refinancing existing debt come at a greater expense.
Last year, U.S. treasurys were among the worst-performing asset classes, with long duration treasurys (20+ years) yielding a -11.7% return.
Learn More on the Voronoi App ![]()
To learn more about how the U.S. economy is faring, check out this graphic that visualizes the U.S’ real GDP growth into the first quarter of 2025.
The post Visualizing the Interest Rates of U.S. Treasurys (2020-2025) appeared first on Visual Capitalist.