![]()
See this visualization first on the Voronoi app.

Use This Visualization
2025 Marks the 5th Worst Start to a Year in S&P 500 History
This was originally posted on our Voronoi app. Download the app for free on iOS or Android and discover incredible data-driven charts from a variety of trusted sources.
Key Takeaways
- 2025 ranks as the fifth worst start to a year for the S&P 500 index
- Through the first 73 trading days, the index fell by 10.2% due to Trump’s renewed tariff threats
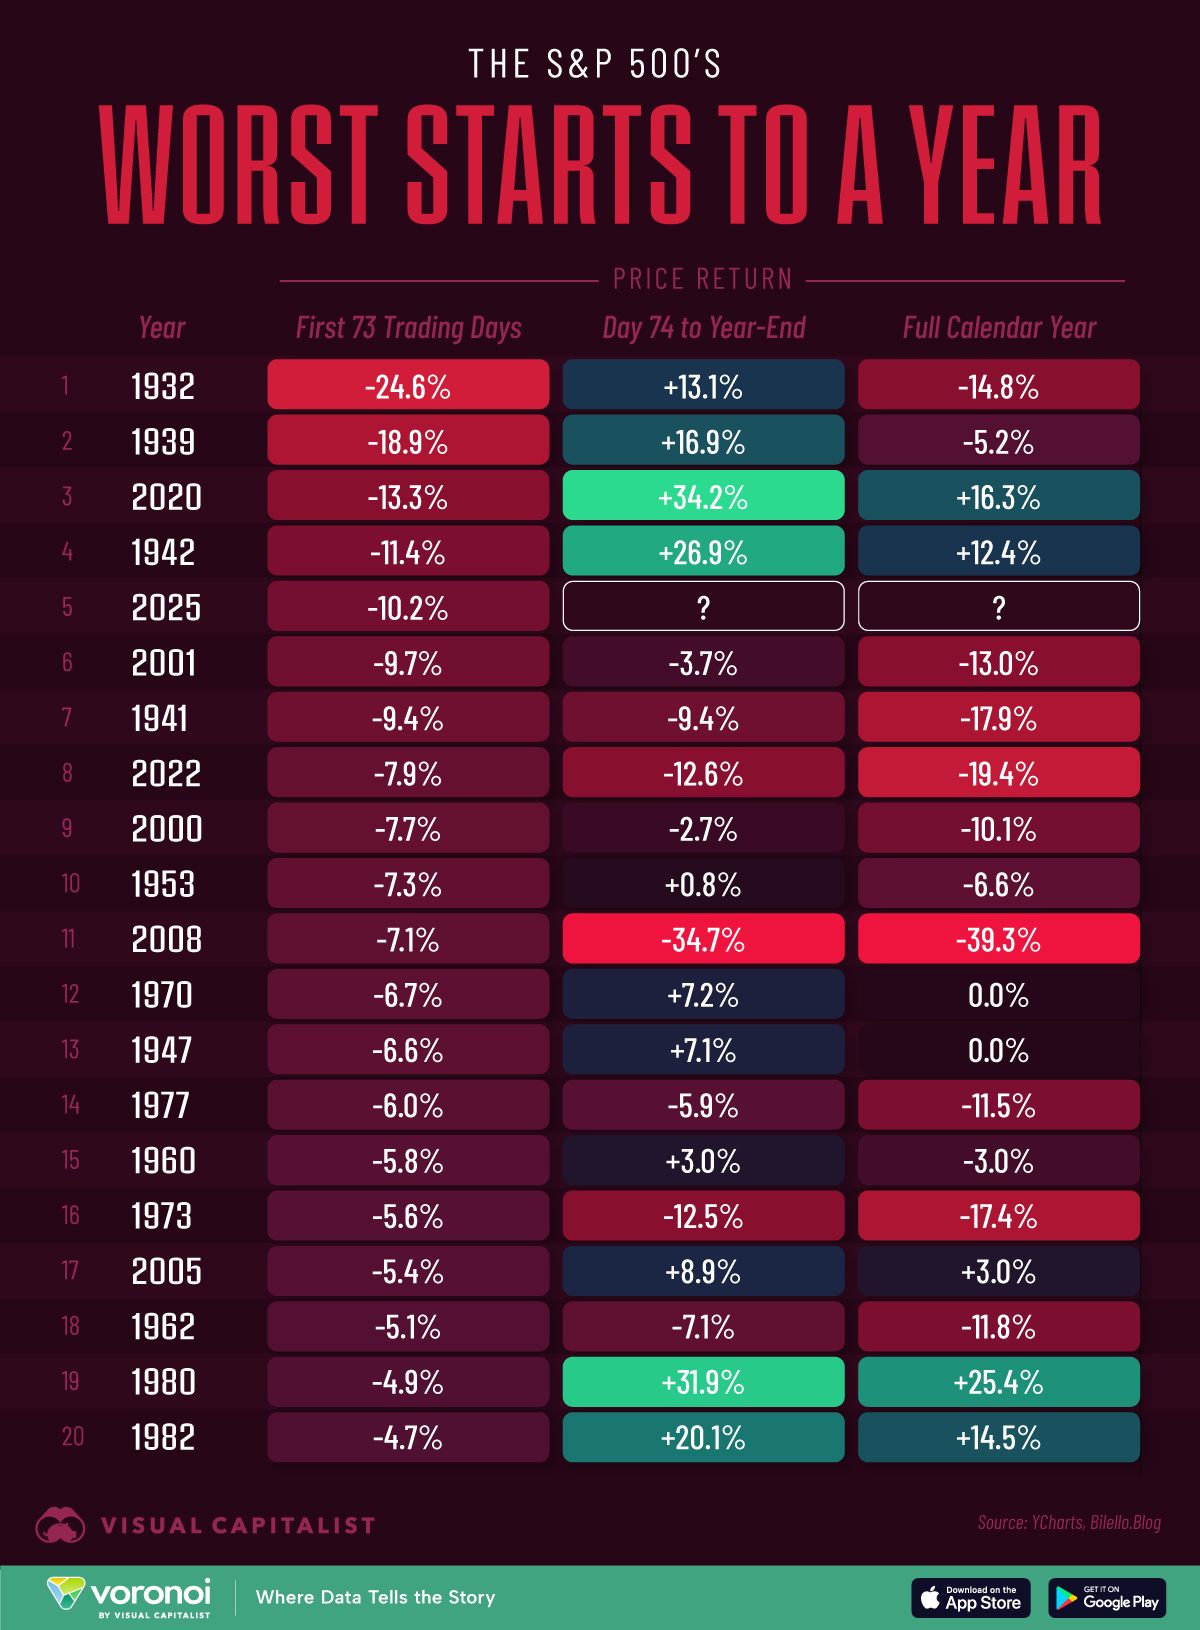
The stock market’s rocky start to 2025 has investors questioning how it stacks up in history. After 73 trading days, the S&P 500 is down enough to mark the fifth worst start to a year for the S&P 500 since the index was created.
This places 2025 alongside other turbulent years marked by recessions, financial crises, and global uncertainty. In this graphic, we rank the worst starts in S&P 500 history, while also showing how the market performed in the months that followed.
Data & Discussion
The data we used to create this graphic comes from YCharts, sourced from the blog of Charlie Bilello.
| Rank | Year | Price Return (First 73 Trading Days) |
Price Return (Day 74 to Year-End) |
Price Return (Full Calendar Year) |
|---|---|---|---|---|
| 1 | 1932 | -24.6% | 13.1% | -14.8% |
| 2 | 1939 | -18.9% | 16.9% | -5.2% |
| 3 | 2020 | -13.3% | 34.2% | 16.3% |
| 4 | 1942 | -11.4% | 26.9% | 12.4% |
| 5 | 2025 | -10.2% | — | — |
| 6 | 2001 | -9.7% | -3.7% | -13.0% |
| 7 | 1941 | -9.4% | -9.4% | -17.9% |
| 8 | 2022 | -7.9% | -12.6% | -19.4% |
| 9 | 2000 | -7.7% | -2.7% | -10.1% |
| 10 | 1953 | -7.3% | 0.8% | -6.6% |
| 11 | 2008 | -7.1% | -34.7% | -39.3% |
| 12 | 1970 | -6.7% | 7.2% | 0.0% |
| 13 | 1947 | -6.6% | 7.1% | 0.0% |
| 14 | 1977 | -6.0% | -5.9% | -11.5% |
| 15 | 1960 | -5.8% | 3.0% | -3.0% |
| 16 | 1973 | -5.6% | -12.5% | -17.4% |
| 17 | 2005 | -5.4% | 8.9% | 3.0% |
| 18 | 1962 | -5.1% | -7.1% | -11.8% |
| 19 | 1980 | -4.9% | 31.9% | 25.4% |
| 20 | 1982 | -4.7% | 20.1% | 14.5% |
Let’s take a closer look at the five worst years from this dataset.
1932: The Great Depression
The worst start to a year for the S&P 500 came in 1932, during the Great Depression. This period was marked by widespread bank failures, high unemployment, and collapsing industrial production. Although the market fell 24.6% in the first 73 trading days, it managed a modest rebound later in the year, ending with a -14.8% calendar year return.
1939: The Brink of World War II
In 1939, markets tumbled as geopolitical tensions escalated into the outbreak of World War II. Once again, the S&P 500 rebounded, managing to end the calendar year with a less severe -5.2% return.
2020: COVID-19 Pandemic
2020 was the third worst start to a year for the S&P 500 due to the rapid spread of COVID-19 and introduction of public lockdowns. This year can also be considered an outlier, as unprecedented stimulus measures and a tech rally fueled a massive comeback for the stock market.
1942: World War II Uncertainty
Uncertainty around World War II’s outcome weighed heavily on investor sentiment. Optimism improved mid-year as the Allies gained momentum, driving a strong market rebound by year-end. Similar to 2020, 1942 ended the year with a positive double-digit return.
2025: Trump Tariff Uncertainty
The S&P 500’s initial decline of 10.2% in 2025 was largely the result of escalating tariff threats and trade war fears. The year could still end in the green, however, as Trump’s stance on tariffs appears to be softening.
For context, the majority of institutions predicted that in 2025, the S&P 500 would see a 10-15% return. As of May 1, 2025, the S&P 500 has recovered from its low of 4,982.77 and is currently trading at 5,604.14 (down 4.7% year-to-date).
See More Data Visualizations on the Voronoi App ![]()
If you want to learn more about the stock market, check out this graphic ranking the most volatile trading days in S&P 500 history.