![]()
See this visualization first on the Voronoi app.
Use This Visualization
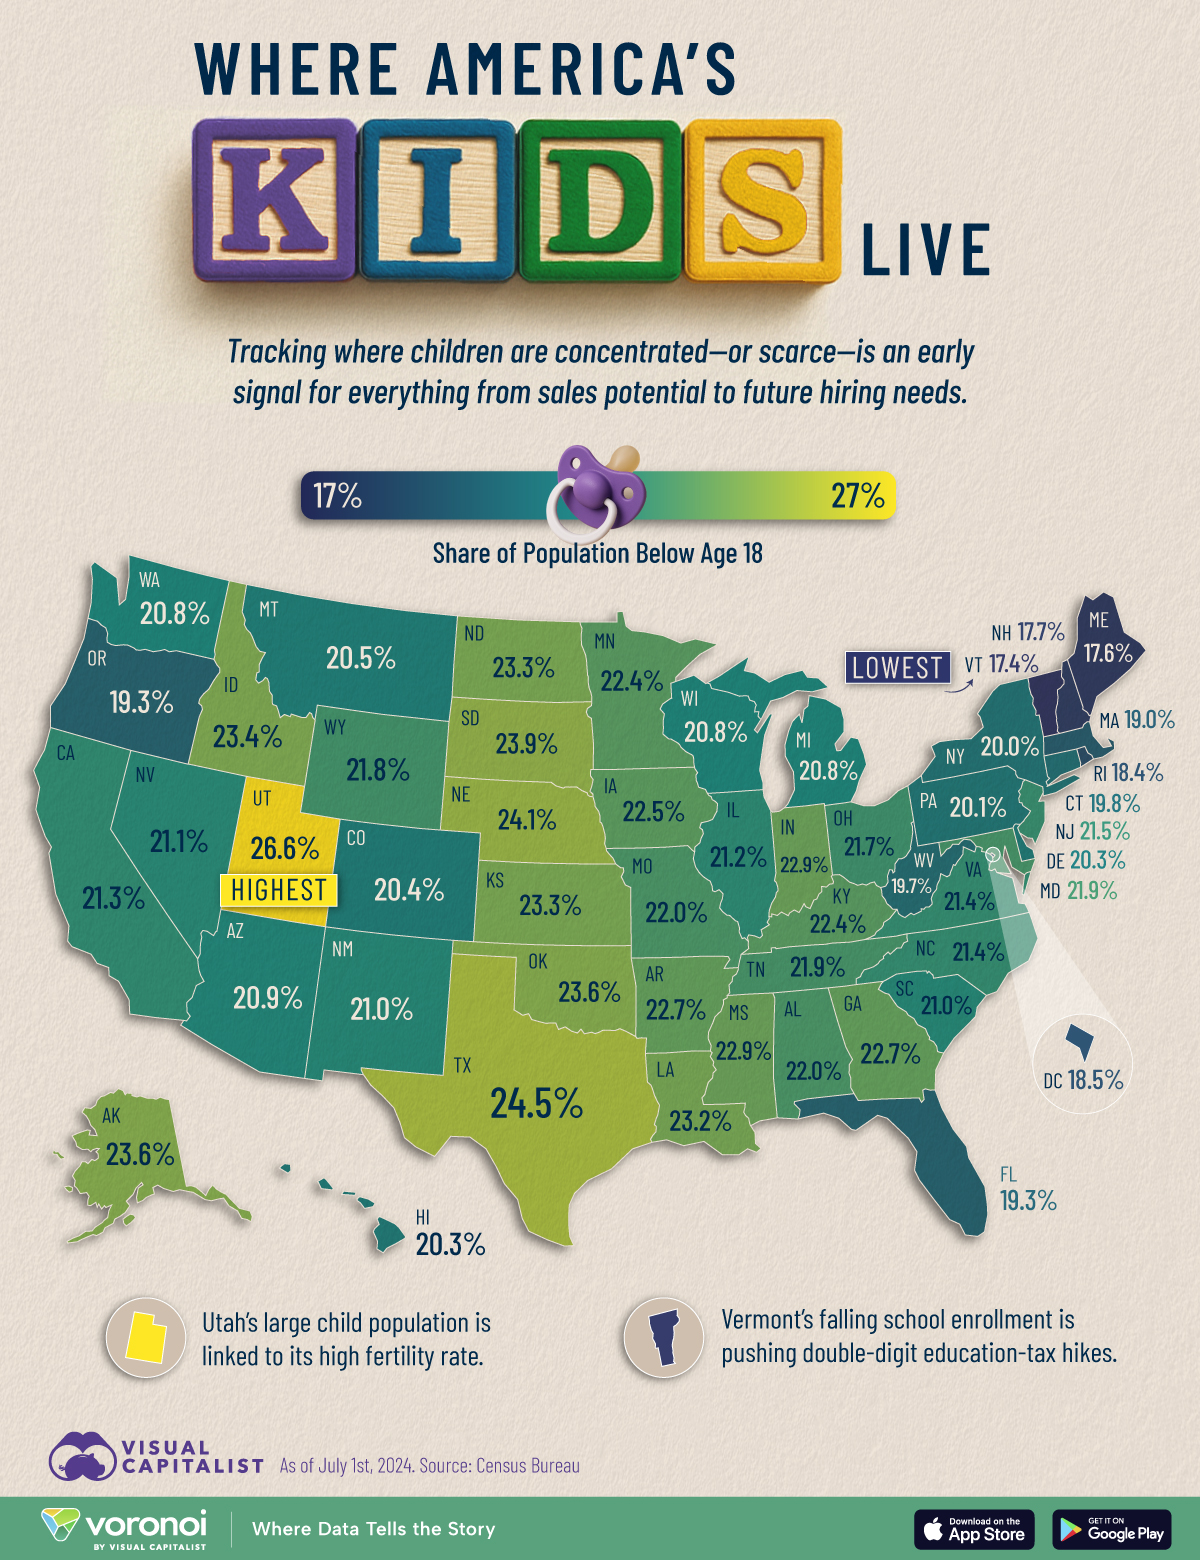
Mapped: Share of Children in Each U.S. State
This was originally posted on our Voronoi app. Download the app for free on iOS or Android and discover incredible data-driven charts from a variety of trusted sources.
Key Takeaways
- Utah tops all states in the share of residents under 18 (27%), a distinction linked to its relatively high fertility rate.
- Vermont’s low child share is thinning school enrollment and pushing double-digit education-tax hikes.
The U.S. is aging, but not evenly. Falling birth rates and a swelling retiree population mean today’s national average for children is just 21.7% of residents
This map visualizes the share of children in every state, laying bare a stark geographic divide that hints at future economic winners and losers. Data for this map is sourced from the Census Bureau population estimates as of July 1st, 2024.
Ranked: U.S. States With the Most Children
Utah tops the ranking at 27%, buoyed by its fertility rate—at 1.92 per woman of child-bearing age. For reference, the fertility rate measures the number of children an adult women will bear in her lifetime. Thus, a higher fertility rate equals more children.
And despite Utah seeing the largest declines in fertility this century, it’s still top-four across the country.
| Rank | State | Code | Share of Population Below 18 (%) |
|---|---|---|---|
| 1 | Utah | UT | 26.6 |
| 2 | Texas | TX | 24.5 |
| 3 | Nebraska | NE | 24.1 |
| 4 | South Dakota | SD | 23.9 |
| 5 | Alaska | AK | 23.6 |
| 6 | Oklahoma | OK | 23.6 |
| 7 | Idaho | ID | 23.4 |
| 8 | Kansas | KS | 23.3 |
| 9 | North Dakota | ND | 23.3 |
| 10 | Louisiana | LA | 23.2 |
| 11 | Indiana | IN | 22.9 |
| 12 | Mississippi | MS | 22.9 |
| 13 | Arkansas | AR | 22.7 |
| 14 | Georgia | GA | 22.7 |
| 15 | Iowa | IA | 22.5 |
| 16 | Kentucky | KY | 22.4 |
| 17 | Minnesota | MN | 22.4 |
| 18 | Alabama | AL | 22.0 |
| 19 | Missouri | MO | 22.0 |
| 20 | Maryland | MD | 21.9 |
| 21 | Tennessee | TN | 21.9 |
| 22 | Wyoming | WY | 21.8 |
| 23 | Ohio | OH | 21.7 |
| 24 | New Jersey | NJ | 21.5 |
| 25 | North Carolina | NC | 21.4 |
| 26 | Virginia | VA | 21.4 |
| 27 | California | CA | 21.3 |
| 28 | Illinois | IL | 21.2 |
| 29 | Nevada | NV | 21.1 |
| 30 | New Mexico | NM | 21.0 |
| 31 | South Carolina | SC | 21.0 |
| 32 | Arizona | AZ | 20.9 |
| 33 | Michigan | MI | 20.8 |
| 34 | Washington | WA | 20.8 |
| 35 | Wisconsin | WI | 20.8 |
| 36 | Montana | MT | 20.5 |
| 37 | Colorado | CO | 20.4 |
| 38 | Delaware | DE | 20.3 |
| 39 | Hawaii | HI | 20.3 |
| 40 | Pennsylvania | PA | 20.1 |
| 41 | New York | NY | 20.0 |
| 42 | Connecticut | CT | 19.8 |
| 43 | West Virginia | WV | 19.7 |
| 44 | Florida | FL | 19.3 |
| 45 | Oregon | OR | 19.3 |
| 46 | Massachusetts | MA | 19.0 |
| 47 | District of Columbia | DC | 18.5 |
| 48 | Rhode Island | RI | 18.4 |
| 49 | New Hampshire | NH | 17.7 |
| 50 | Maine | ME | 17.6 |
| 51 | Vermont | VT | 17.4 |
Neighboring Idaho (23%), South Dakota (24%), and Nebraska (24%) also exceed the national average of children. High fertility rates combined with in-migration of young families keeps the Mountain West demographically youthful.
New England’s Demographic Squeeze
At the other end of the list, Vermont’s children make up just 17% of residents—the lowest share in the country (aside from Puerto Rico not visualized on this map).
Maine and New Hampshire follow at 18%, while Rhode Island and Massachusetts sit at 18–19%.
Low birth rates and persistent out-migration of young adults have sped up population aging across New England, raising alarms over future workforce shortages and rising dependency ratios.
Why the Child Gap Matters for Schools and Budgets
States with fewer kids face practical strains.
In Vermont, enrollment has shrunk by more than 30,000 students over the past three decades.
This creates a vicious cycle: half of Vermont’s 250 school districts have fewer than 100 students, yet maintaining these small schools is expensive, driving up property taxes while educational quality may suffer.
Meanwhile, child-rich states must expand classrooms and childcare but they gain a long-term edge: a deeper talent pipeline that attracts employers and fuels economic growth.
Diverging youth populations today will shape everything from labor markets to congressional apportionment in the decades ahead.
Learn More on the Voronoi App ![]()
This most can be accompanied by checking out U.S. States by Share of Older Adults on Voronoi, the new app from Visual Capitalist.