![]()
See this visualization first on the Voronoi app.
Use This Visualization
Visualizing Global Energy Investment (2015-2025)
This was originally posted on our Voronoi app. Download the app for free on iOS or Android and discover incredible data-driven charts from a variety of trusted sources.
Key Takeaways
- In 2025, global renewable energy investment is projected to hit $780 billion, outpacing oil investment by $237 billion.
- Over the past decade, investment in renewables has surged 109%.
Global energy investment has shifted dramatically in the last decade.
As the world transitions to cleaner sources, capital is flowing into technologies that support electrification and decarbonization. Bolstering this trend are rapidly declining costs across solar and wind power, in particular.
This graphic shows global energy investment from 2015 to 2025, based on data from the IEA.
Renewables Are Now the Largest Investment Worldwide
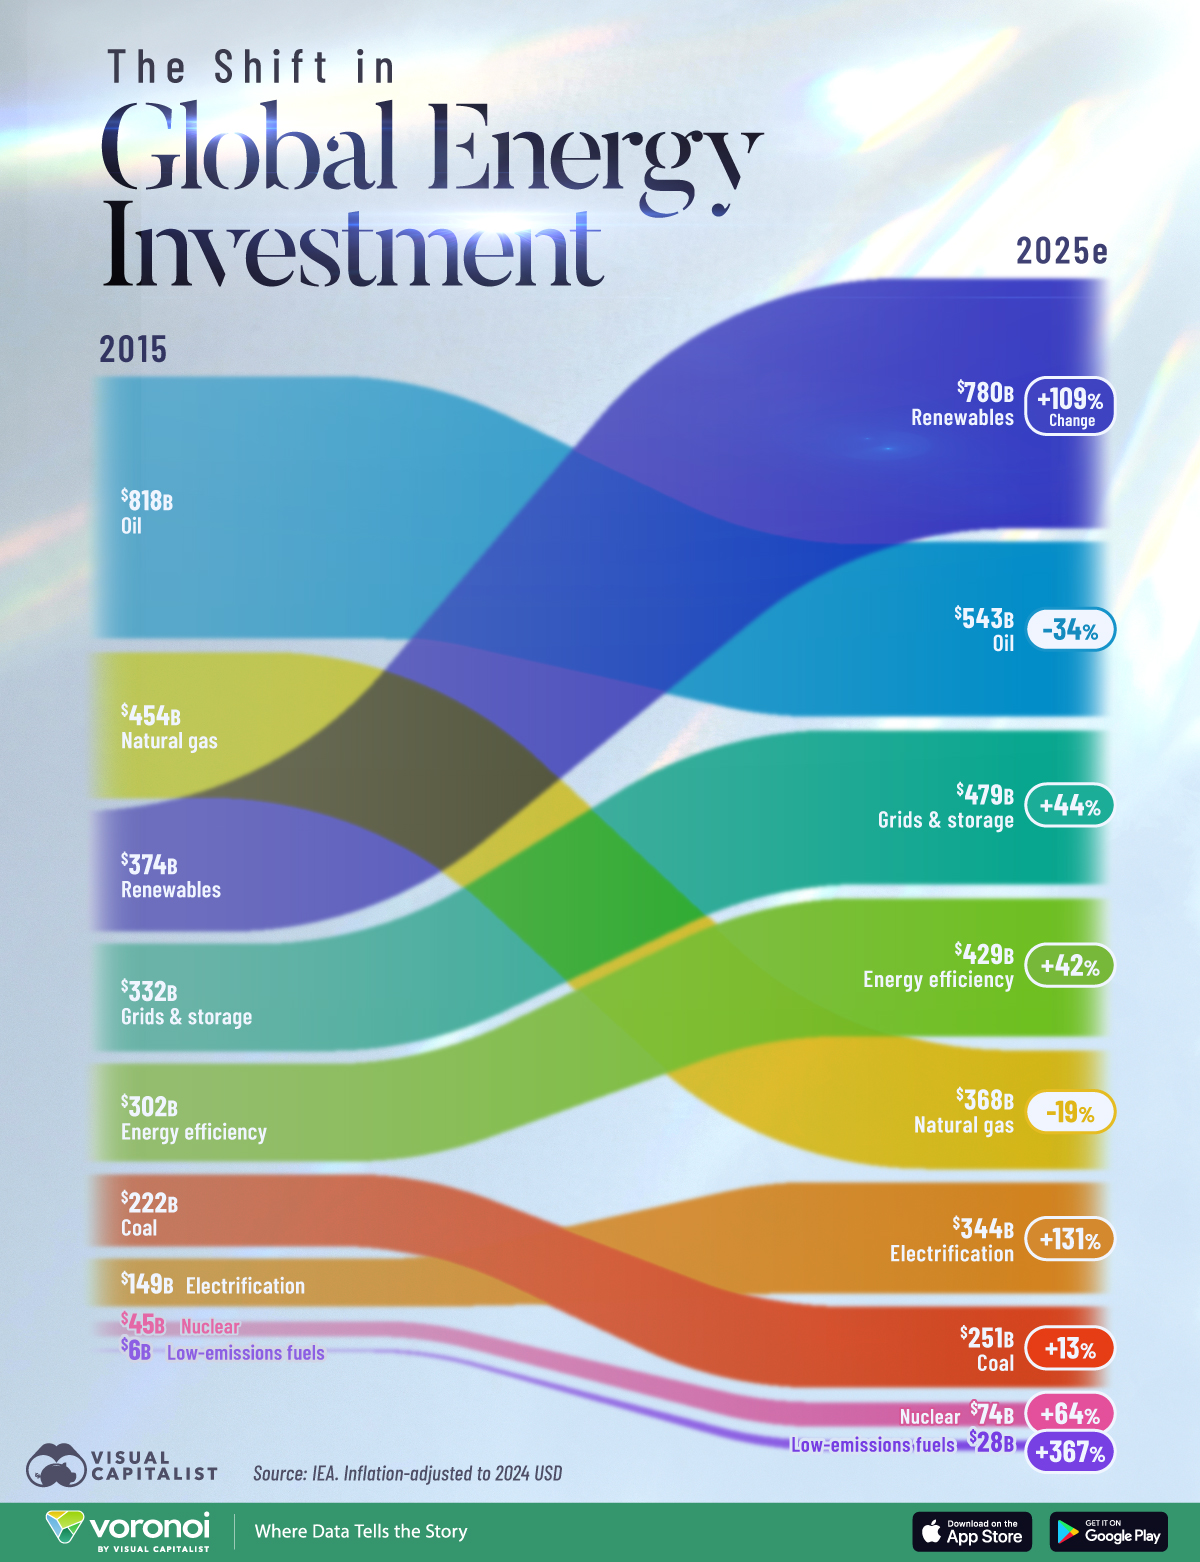
Below, we compare projected 2025 investment with 2015 levels across major energy sources, including renewables, oil, and nuclear. Figures are inflation-adjusted to 2024 U.S. dollars.
| Category | 2015 (Billion USD) | 2025E (Billion USD) | Change % |
|---|---|---|---|
| Renewables | $374 | $780 | 109% |
| Oil | $818 | $543 | -34% |
| Grids & storage | $332 | $479 | 44% |
| Energy efficiency | $302 | $429 | 42% |
| Natural gas | $454 | $368 | -19% |
| Electrification | $149 | $344 | 131% |
| Coal | $222 | $251 | 13% |
| Nuclear | $45 | $74 | 64% |
| Low-emissions fuels | $6 | $28 | 367% |
In 2015, oil dominated global energy investment at $818 billion. By 2025, that figure is expected to fall to $543 billion.
Meanwhile, renewable energy will soar from $374 billion to $780 billion, making it the largest category overall. This 109% growth highlights the world’s accelerating shift away from fossil fuels and toward sustainable power generation.
Electrification—which powers data centers and electric vehicles—is set to rise to $344 billion in 2025. Even more striking is the 367% jump in low-emissions fuels, from just $6 billion in 2015 to $28 billion in 2025. These categories, though smaller in absolute terms, show where future energy systems are headed.
By contrast, oil and natural gas are seeing notable declines, down 34% and 19% respectively over the decade.
Learn More on the Voronoi App ![]()
If you enjoyed today’s post, check out this graphic on the decline in renewable energy costs on Voronoi, the new app from Visual Capitalist.