Published
22 minutes ago
on
October 30, 2025
| 1,827 views
-->
By
Ryan Bellefontaine
Graphics & Design
- Abha Patil
The following content is sponsored by Shale Crescent USA
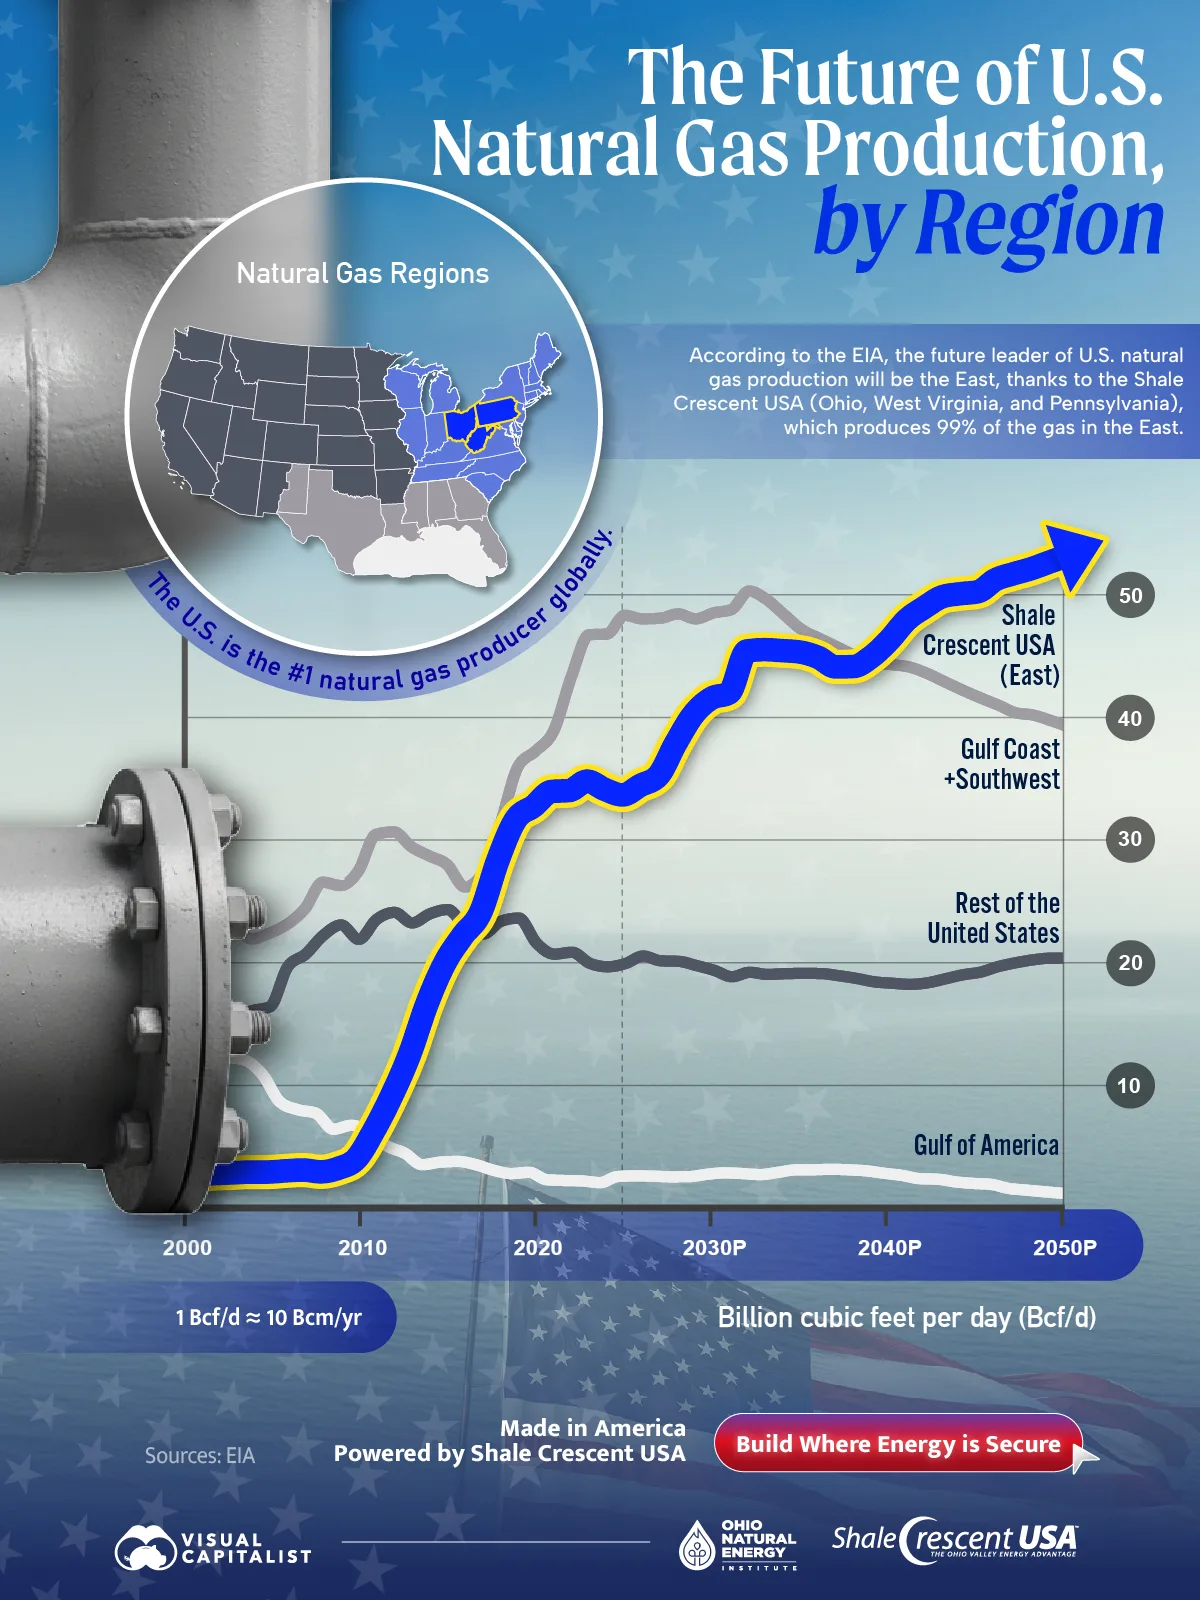
The Future of U.S. Natural Gas Production, by Region
Key Takeaways
- The East will be the largest U.S. gas-producing region starting in 2039.
- The Shale Crescent USA (OH, WV, PA) supplies ~99% of the East’s gas, and from 2000 to 2025, its output jumped nearly 1,200%, demonstrating a paradigm shift in American energy production.
- Low-cost, abundant, and predictable gas supplies can greatly improve manufacturers’ profit margins and operational stability.
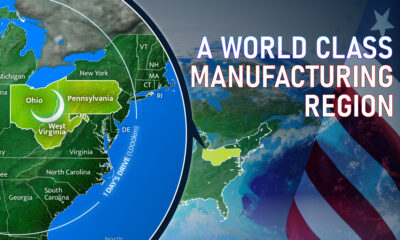
U.S. gas production has reshaped the country’s energy map. The most striking shift is where the growth has occurred and is projected to occur. It is in the states of Ohio, West Virginia, and Pennsylvania.
This graphic, in partnership with Shale Crescent USA, shows how regional U.S. natural gas output evolves from 2000 to 2050, highlighting the East’s rise, using data from the EIA.
East Leads Natural Gas—and Stays on Top
According to the EIA, the East becomes and remains the largest-producing region starting in 2039. In fact, the Shale Crescent states—Ohio, West Virginia, and Pennsylvania—supply nearly all of the East’s gas (about 99%), and momentum continues.
Here is a table that shows regional U.S. natural gas production (Bcf/d) from 2000 to 2050.
| Year | Gulf of America | Other U.S. | Gulf Coast + Southwest | East (Shale Crescent USA) |
|---|---|---|---|---|
| 2000 | 0 | 13.9 | 36 | 2.7 |
| 2001 | 13.8 | 14.9 | 22.7 | 2.4 |
| 2002 | 12.4 | 15.2 | 21.8 | 2.5 |
| 2003 | 12.1 | 15.5 | 22.2 | 2.6 |
| 2004 | 10.9 | 16 | 21.4 | 2.6 |
| 2005 | 8.6 | 16.4 | 21.9 | 2.6 |
| 2006 | 8 | 19.7 | 22.6 | 2.7 |
| 2007 | 7.7 | 20.7 | 23.9 | 2.8 |
| 2008 | 6.3 | 22.3 | 26.1 | 2.7 |
| 2009 | 6.7 | 23.1 | 25.8 | 2.9 |
| 2010 | 6.2 | 22 | 27 | 3.7 |
| 2011 | 5 | 23.6 | 30.1 | 6.1 |
| 2012 | 4.4 | 24.2 | 30.3 | 9 |
| 2013 | 3.4 | 23.3 | 29 | 12.4 |
| 2014 | 3.6 | 24.1 | 28.3 | 16.6 |
| 2015 | 3.7 | 24.4 | 27.6 | 20 |
| 2016 | 3.4 | 23 | 25.7 | 22.2 |
| 2017 | 2.9 | 22.4 | 26.8 | 24.2 |
| 2018 | 2.7 | 23.5 | 30.9 | 28.6 |
| 2019 | 2.8 | 23.7 | 35.7 | 31.9 |
| 2020 | 2.1 | 21.6 | 37 | 33 |
| 2021 | 2.1 | 20.7 | 38.7 | 34.2 |
| 2022 | 2 | 20.9 | 43.2 | 34.3 |
| 2023 | 1.9 | 20 | 46.6 | 35.1 |
| 2024 | 2.4 | 19.7 | 46.7 | 34.4 |
| 2025 | 2.5 | 19.9 | 48.2 | 33.9 |
| 2026 | 2.4 | 20.6 | 48 | 34.7 |
| 2027 | 2.4 | 20.2 | 48 | 35.5 |
| 2028 | 2.4 | 20.1 | 48.4 | 38.2 |
| 2029 | 2.6 | 19.8 | 48 | 40.6 |
| 2030 | 2.7 | 19.4 | 48.4 | 41.9 |
| 2031 | 2.7 | 18.9 | 48.7 | 42.4 |
| 2032 | 2.6 | 19.2 | 50.3 | 45.9 |
| 2033 | 2.8 | 19 | 49.5 | 46 |
| 2034 | 3 | 19.1 | 48.3 | 45.9 |
| 2035 | 3 | 19.1 | 47 | 45.8 |
| 2036 | 3 | 19.1 | 46.3 | 45.4 |
| 2037 | 3 | 18.9 | 45.6 | 44.6 |
| 2038 | 2.9 | 18.7 | 44.9 | 44.6 |
| 2039 | 2.7 | 18.4 | 44.3 | 45.4 |
| 2040 | 2.5 | 18.3 | 44.2 | 46.8 |
| 2041 | 2.2 | 18.2 | 44 | 48.5 |
| 2042 | 2.2 | 18.3 | 43.4 | 49.5 |
| 2043 | 2 | 18.7 | 42.7 | 50.4 |
| 2044 | 1.8 | 19 | 42.1 | 50.6 |
| 2045 | 1.8 | 19.2 | 41.4 | 50.8 |
| 2046 | 1.4 | 19.7 | 40.8 | 51.8 |
| 2047 | 1.3 | 20 | 40.2 | 52.3 |
| 2048 | 1.1 | 20.3 | 40 | 52.7 |
| 2049 | 1 | 20.4 | 39.5 | 53.2 |
| 2050 | 1 | 20.4 | 39 | 53.8 |
The East first surpassed the Gulf of America in 2011, then topped the “Rest of the United States” in 2017. It is projected to overtake the combined “Gulf Coast + Southwest” in 2039 at 45 Bcf/d.
From 2000 to 2025, East output jumped nearly 1,200%—from 2.7 to 33.9 Bcf/d, demonstrating a paradigm shift in American energy production.
From 2025 to 2050, the East is expected to climb another 59% to 53.8 Bcf/d. By 2050, it will produce nearly as much as all other regions of the U.S. combined (53.8 vs. 60.4 Bcf/d).
A Manufacturing Edge in the Shale Crescent
As output concentrates in the East, midstream flows, storage, and basis prices adjust accordingly.
For planners and investors, regional growth influences industrial siting. Therefore, understanding where supply originates and is projected to be is critical to the success and stability of energy-intensive projects.
For manufacturers, the Shale Crescent USA pairs abundant, low-cost gas with dense customer demand and logistics. This means energy-intensive consumers have a world-class opportunity to source energy from under their feet, experience shorter supply chains, lower costs, and speed time-to-market.
Additionally, proximity to pipelines, storage, and interstates helps compress working capital and improve reliability. In turn, this translates into durable cost advantages and more resilient operations. There is no other location on the planet that has both a world-class energy supply and consumer demand in the same location.
![]()
Build Where Energy is Secure
Related Topics: #oil #natural gas #Gas #ohio #West Virginia #Pennsylvania #Shale crescent #gulf of america
Click for Comments
var disqus_shortname = "visualcapitalist.disqus.com";
var disqus_title = "The Future of U.S. Natural Gas Production, by Region";
var disqus_url = "https://www.visualcapitalist.com/sp/sc01-the-future-of-us-natural-gas-production-by-region/";
var disqus_identifier = "visualcapitalist.disqus.com-183788";
More from Shale Crescent USA
-
Energy1 week ago
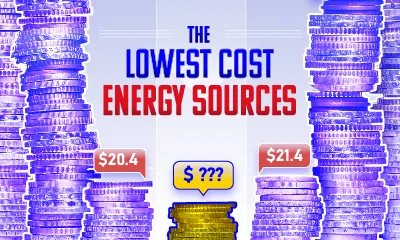
Ranked: The Lowest Cost Energy Sources
Shale Crescent USA’s natural gas ranks as the lowest cost energy on a $/BOE basis—outpacing NYMEX, coal, oil, and imported LNG—and offers a manufacturing edge.
-
Energy2 weeks ago
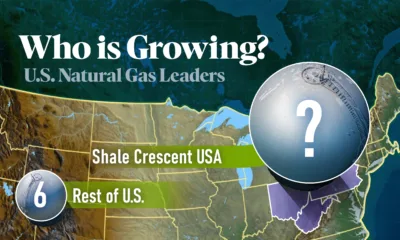
Who is Growing? U.S. Natural Gas Leaders
Which U.S. regions lead natural gas production growth? See why the Shale Crescent is now fueling millions more homes and factories.
-
Energy3 weeks ago
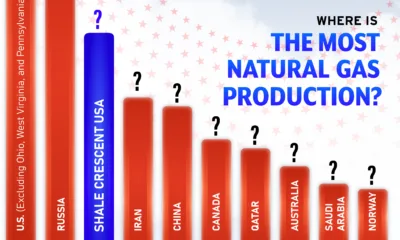
Visualized: Where is the Most Natural Gas Production?
See how natural gas production stacks up globally and why the Shale Crescent ranks third—a strategic edge for U.S. manufacturing.
-
Energy1 month ago
Shale Crescent USA: A World-Class Manufacturing Region
Shale Crescent USA brings energy, customers, and infrastructure together in one region, helping manufacturers reduce costs as reshoring accelerates.
Subscribe
Please enable JavaScript in your browser to complete this form.Join 375,000+ email subscribers: *Sign Up