![]()
See more visuals like this on the Voronoi app.
Use This Visualization
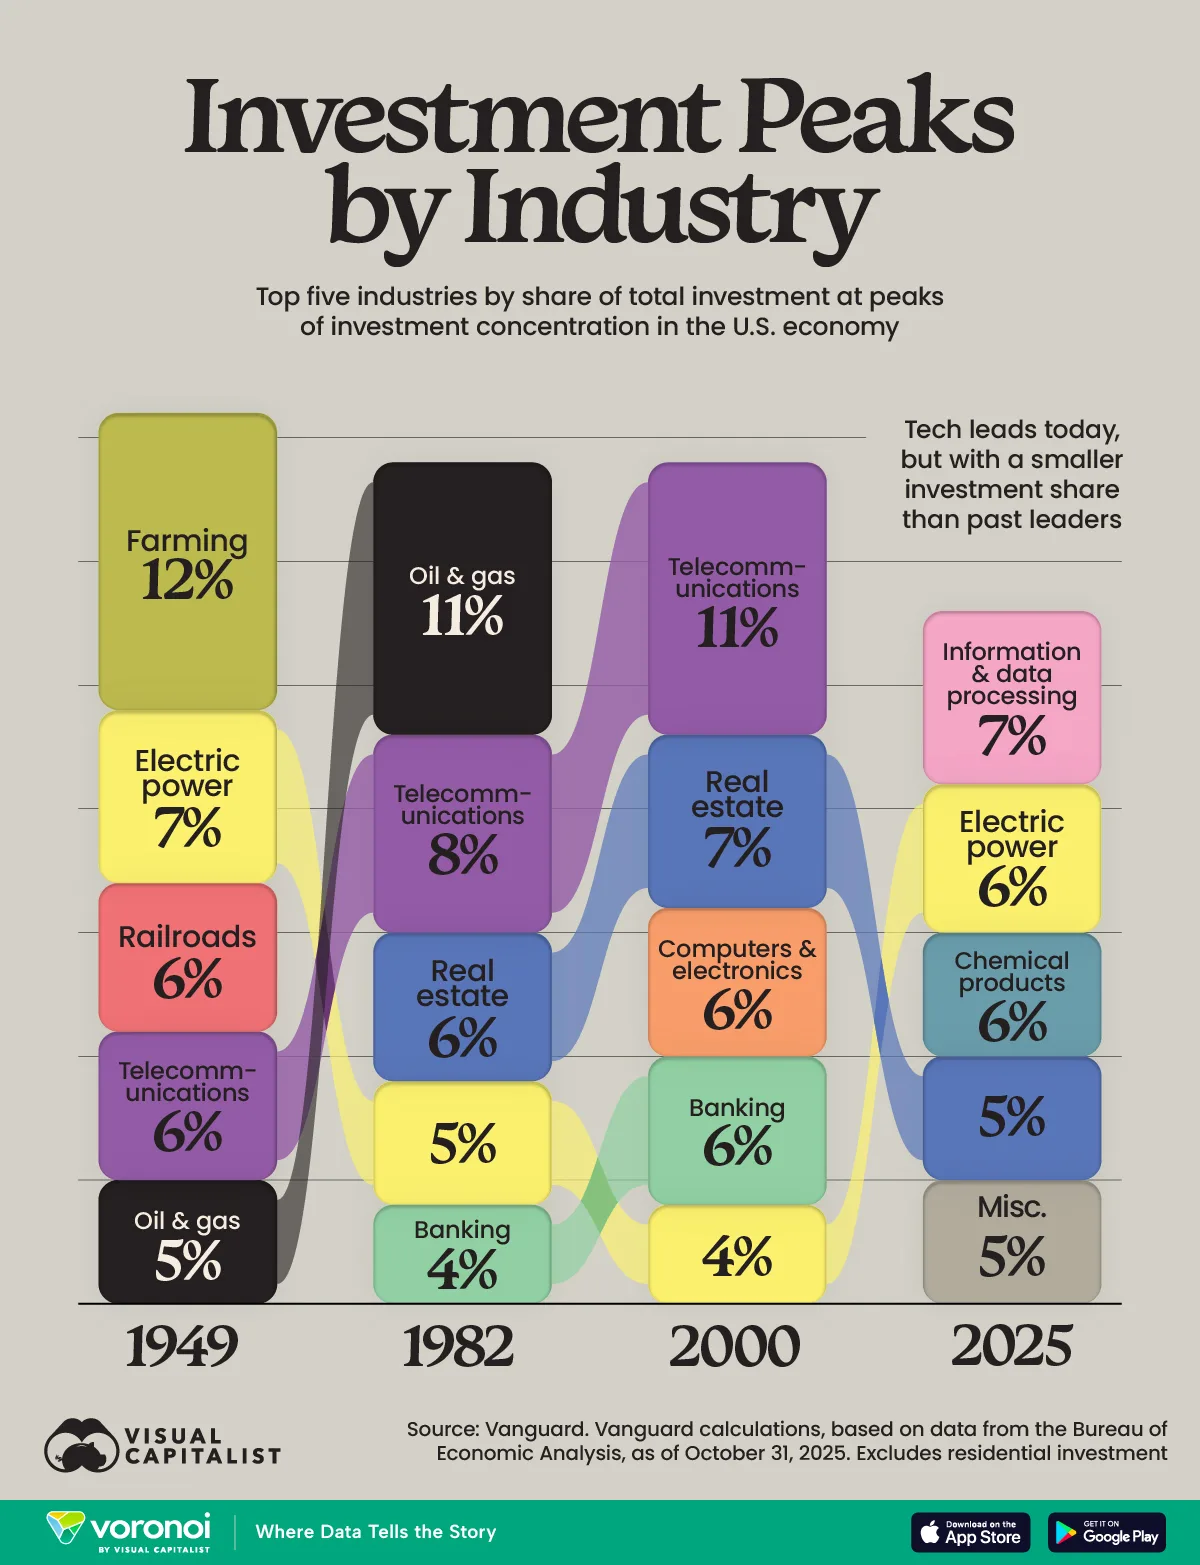
Ranked: Top U.S. Industries by Investment Share (1949–2025)
See visuals like this from many other data creators on our Voronoi app. Download it for free on iOS or Android and discover incredible data-driven charts from a variety of trusted sources.
Key Takeaways
- The industries attracting the most investment in the U.S. have shifted dramatically over time, from farming and railroads to technology and data.
- Today’s leading sector, information and data processing, commands a smaller share of total investment than past dominant industries.
Investment has long been a driving force behind U.S. economic growth, but the sectors attracting the most capital have changed with each era. From agriculture and electrification in the mid-20th century to telecommunications, real estate, and now digital infrastructure, investment trends reflect broader shifts in technology, consumer demand, and policy.
This visualization shows the top five U.S. industries by share of total investment at key historical peaks, spanning 1949 to 2025. The data for this visualization comes from Vanguard, using calculations based on Bureau of Economic Analysis data as of October 31, 2025. The figures exclude residential investment.
Postwar America: Farming, Power, and Railroads
In 1949, U.S. investment was concentrated in industries that supported a rapidly expanding, industrializing economy.
Farming led with a 12% share of total investment, reflecting the sector’s central role in employment and production. Electric power and railroads followed closely, underscoring the importance of nationwide infrastructure as the U.S. rebuilt and modernized after World War II. Telecommunications and oil and gas rounded out the top five.
| Era | Rank | Industry | Share |
|---|---|---|---|
| 1949 | 1 | Farming | 12% |
| 2 | Electric power | 7% | |
| 3 | Railroads | 6% | |
| 4 | Telecommunications | 6% | |
| 5 | Oil and gas | 5% | |
| 1982 | 1 | Oil and gas | 11% |
| 2 | Telecommunications | 8% | |
| 3 | Real estate | 6% | |
| 4 | Electric power | 5% | |
| 5 | Banking | 4% | |
| 2000 | 1 | Telecommunications | 11% |
| 2 | Real estate | 7% | |
| 3 | Computers and electronics | 6% | |
| 4 | Banking | 6% | |
| 5 | Electric power | 4% | |
| 2025 | 1 | Information and data processing | 7% |
| 2 | Electric power | 6% | |
| 3 | Chemical products | 5% | |
| 4 | Real estate | 5% | |
| 5 | Miscellaneous | 5% |
The 1980s and 2000s: Energy, Communication, and Finance
By 1982, investment leadership had shifted toward oil and gas, which accounted for 11% of total investment. Telecommunications and real estate also gained prominence, alongside banking and electric power.
In 2000, at the height of the dot-com era, telecommunications topped the list, while computers and electronics emerged as a major investment destination. Real estate and banking also featured prominently.
2025: Technology Dominates, but Less Concentrated
Today, information and data processing leads U.S. investment with a 7% share—making it the top industry, but with far less dominance than historical leaders. Electric power, chemical products, and real estate follow closely, each capturing around 5–6% of total investment.
This lower concentration suggests a more diversified investment landscape, where capital is spread across a wider range of industries rather than clustered in a single dominant sector.
Learn More on the Voronoi App ![]()
If you enjoyed today’s post, check out America’s $38 Trillion Mountain of Debt on Voronoi, the new app from Visual Capitalist.