
Published
4 minutes ago
on
June 2, 2026
| 20 views
-->
By
Julia Wendling
Graphics & Design
- Jennifer West
The following content is sponsored by Hinrich Foundation
Charted: Annual Space Launches by Superpower (1957–2025)
The race for space launches is accelerating fast, and the U.S. is pulling far ahead of every other nation. In 2025, the United States recorded 181 space launches, nearly double China’s 93 launches and far ahead of Russia’s 17.
What started as a Cold War rivalry has evolved into a commercial and geopolitical race fueled by satellite internet, reusable rockets, and military demand. This graphic, created in partnership with the Hinrich Foundation, charts annual space launches by superpowers from 1957 to 2025.
First Space Age: Soviet Dominance
The first space age began in 1957 with the Soviet Union’s launch of Sputnik 1, the world’s first satellite. Over the next three decades, the Soviet Union led global launches and regularly outpaced the United States.
| Launch Year | China | Russia/Soviet Union | United States | Space Ages |
|---|---|---|---|---|
| 1957 | 0 | 2 | 1 | First Space Age |
| 1958 | 0 | 5 | 23 | First Space Age |
| 1959 | 0 | 4 | 21 | First Space Age |
| 1960 | 0 | 9 | 29 | First Space Age |
| 1961 | 0 | 9 | 41 | First Space Age |
| 1962 | 0 | 22 | 59 | First Space Age |
| 1963 | 0 | 24 | 46 | First Space Age |
| 1964 | 0 | 36 | 64 | First Space Age |
| 1965 | 0 | 53 | 71 | First Space Age |
| 1966 | 0 | 51 | 77 | First Space Age |
| 1967 | 0 | 74 | 60 | First Space Age |
| 1968 | 0 | 80 | 48 | First Space Age |
| 1969 | 0 | 82 | 41 | First Space Age |
| 1970 | 1 | 87 | 29 | First Space Age |
| 1971 | 1 | 91 | 33 | First Space Age |
| 1972 | 0 | 79 | 32 | First Space Age |
| 1973 | 1 | 90 | 25 | First Space Age |
| 1974 | 2 | 85 | 23 | First Space Age |
| 1975 | 3 | 93 | 30 | First Space Age |
| 1976 | 3 | 100 | 26 | First Space Age |
| 1977 | 0 | 102 | 26 | First Space Age |
| 1978 | 1 | 91 | 33 | First Space Age |
| 1979 | 1 | 89 | 16 | First Space Age |
| 1980 | 0 | 90 | 15 | First Space Age |
| 1981 | 1 | 100 | 19 | First Space Age |
| 1982 | 1 | 108 | 18 | First Space Age |
| 1983 | 1 | 100 | 22 | First Space Age |
| 1984 | 3 | 97 | 23 | First Space Age |
| 1985 | 1 | 100 | 19 | First Space Age |
| 1986 | 2 | 94 | 9 | First Space Age |
| 1987 | 2 | 97 | 9 | First Space Age |
| 1988 | 4 | 94 | 11 | First Space Age |
| 1989 | 0 | 75 | 18 | First Space Age |
| 1990 | 5 | 79 | 27 | First Space Age |
| 1991 | 1 | 61 | 19 | First Space Age |
| 1992 | 4 | 55 | 29 | Second Space Age |
| 1993 | 1 | 48 | 27 | Second Space Age |
| 1994 | 5 | 49 | 28 | Second Space Age |
| 1995 | 3 | 33 | 30 | Second Space Age |
| 1996 | 4 | 27 | 33 | Second Space Age |
| 1997 | 6 | 29 | 37 | Second Space Age |
| 1998 | 6 | 25 | 36 | Second Space Age |
| 1999 | 4 | 28 | 31 | Second Space Age |
| 2000 | 5 | 36 | 28 | Second Space Age |
| 2001 | 1 | 23 | 22 | Second Space Age |
| 2002 | 5 | 25 | 17 | Second Space Age |
| 2003 | 7 | 21 | 23 | Second Space Age |
| 2004 | 8 | 23 | 16 | Second Space Age |
| 2005 | 6 | 26 | 12 | Second Space Age |
| 2006 | 6 | 25 | 18 | Second Space Age |
| 2007 | 10 | 26 | 19 | Second Space Age |
| 2008 | 11 | 27 | 15 | Second Space Age |
| 2009 | 6 | 32 | 24 | Second Space Age |
| 2010 | 15 | 31 | 15 | Second Space Age |
| 2011 | 19 | 32 | 18 | Second Space Age |
| 2012 | 19 | 24 | 13 | Second Space Age |
| 2013 | 15 | 32 | 19 | Second Space Age |
| 2014 | 16 | 32 | 23 | Second Space Age |
| 2015 | 19 | 26 | 20 | Second Space Age |
| 2016 | 22 | 17 | 23 | Third Space Age |
| 2017 | 18 | 19 | 29 | Third Space Age |
| 2018 | 39 | 17 | 31 | Third Space Age |
| 2019 | 34 | 22 | 21 | Third Space Age |
| 2020 | 39 | 15 | 37 | Third Space Age |
| 2021 | 56 | 24 | 45 | Third Space Age |
| 2022 | 64 | 21 | 78 | Third Space Age |
| 2023 | 67 | 19 | 108 | Third Space Age |
| 2024 | 68 | 17 | 145 | Third Space Age |
| 2025 | 93 | 17 | 181 | Third Space Age |
In 1969, the year Apollo 11 landed on the Moon, the Soviet Union still completed 82 launches versus America’s 41. Soviet launch activity peaked in 1982 with 108 launches, while the U.S. completed just 18.
Second Space Age: China Rises
The second space age began after the collapse of the Soviet Union. Russia’s annual space launches dropped sharply through the 1990s as the U.S. began closing the gap.
China also started gaining momentum. Its annual launches climbed from 5 in 2000 to 15 by 2010, laying the foundation for its rapid expansion in the years ahead.
Third Space Age: America Pulls Ahead
The modern era of space launches began around 2016 as reusable rockets and private companies transformed the industry. The space economy has now grown to nearly $600 billion.
By 2022, the U.S. completed 78 launches compared to China’s 64. The gap widened further in 2025, when America hit a record 181 launches while China reached 93.
Why Launches Matter
Today, these launches power far more than exploration. Countries with high launch capacity increasingly control satellite internet, military communications, GPS systems, and Earth imaging networks.
That advantage also creates economic and trade benefits across aerospace, semiconductors, and telecommunications.
For a deeper look at how trade, technology, and geopolitics are reshaping global industries, explore the latest research from the Hinrich Foundation.
![]()
Visit the Hinrich Foundation to learn more about space dominance and its importance in global trade.
You may also like
-

Economy2 weeks ago
Ranked: Top 12 Countries with Digital Trade Agreements
As digital trade expands, governments are moving quickly to set the rules that govern how it operates.
-

Economy2 months ago
Ranked: The Fastest-Growing Major Economies in 2025 & 2026
As the global economy adjusts elevated levels of geopolitical uncertainty, growth is becoming increasingly uneven, with India leading the charge.
-

Environment4 months ago
Which Economies Have the Largest Ecological Footprints?
The Ecological Footprint reveals how consumption strains the planet. Which countries leave the biggest mark?
-
Economy5 months ago
How Balanced Is Economic Growth Within Countries?
Levels of economic development differ not only from one country to another, but also dramatically within their own borders. Which countries lead versus lag?
-
Markets7 months ago
Ranked: Number of Trade Agreements Across 30 Economies
Based on data from the World Trade Organization, which countries have the highest and lowest number of trade agreements?
-
Markets8 months ago
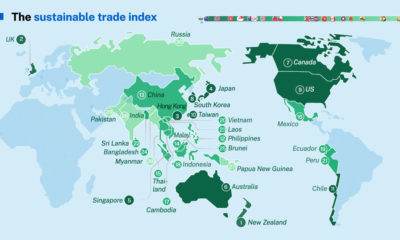
Ranked: The World’s Most Sustainable Economies in 2025
Based on the Hinrich Foundation’s 2025 Sustainable Trade Index, which economies are the most and least sustainable?
-
Economy8 months ago
Ranked: Countries Losing the Most (and Least) from Trump’s Tariffs
Trump’s tariffs affect all major U.S. trading partners, but what matters is how each country’s tariffs compare to its competitors.
-
Economy10 months ago
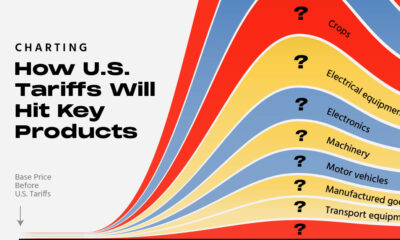
Charting How U.S. Tariffs Will Hit Key Products
U.S. tariffs have climbed to an average rate of 18.6%—the highest since 1933. But what does this mean for everyday consumers?
-
Economy12 months ago
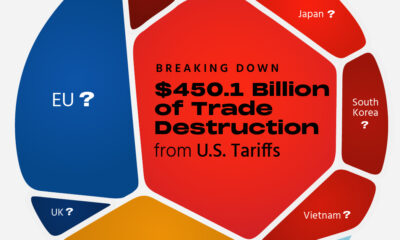
Breaking Down the $450 Billion of Trade Destruction from U.S. Tariffs
The UN has crunched the numbers projecting the ripple effects of Trump’s May 12th tariffs. Which economies are bracing for the biggest hits?
-

Economy1 year ago
Ranked: America’s Services Trade Balances
America’s goods trade deficits have dominated headlines, but a critical part of the equation is being ignored: services trade.
-
AI1 year ago
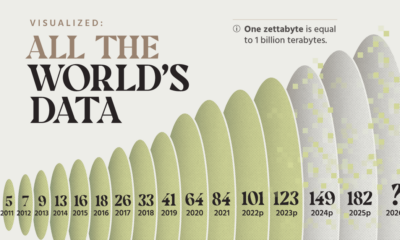
Visualized: All of the World’s Data
More data will be created, captured, and replicated in the next three years than in the rest of human history. But by how much?
-

Economy1 year ago
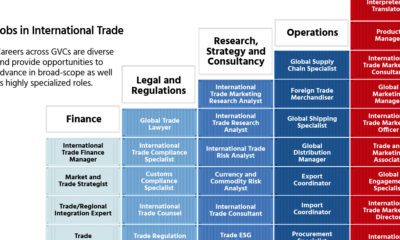
Visualized: The Growing Opportunities in Global Trade Careers
Visual Capitalist has partnered with the Hinrich Foundation to explore the landscape of global trade and find out what students and trade professionals can do to…
-
Green1 year ago
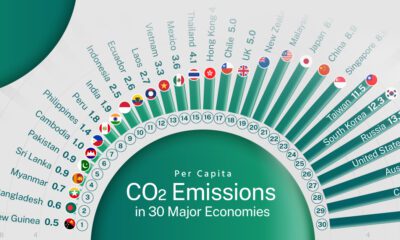
Ranked: CO₂ Emissions Per Person in 30 Economies
CO₂ emissions are reshaping the flows of international trade. Which countries have the highest and lowest CO₂ emissions per capita?
-
Healthcare1 year ago
Mapped: Life Expectancy in Major Economies
Which countries have the highest and lowest life expectancies at birth?
-
Markets2 years ago
Ranked: Government Debt Across Major Economies
Based on data from the IMF’s World Economic Outlook, which countries have the highest and lowest government debt ratios?
-
Markets2 years ago
Ranked: The World’s Most Sustainable Economies in 2024
Based on the Hinrich Foundation’s 2024 Sustainable Trade Index, which economies are the most and least sustainable?
-
Oil and Gas2 years ago
How Oil Is Adding Fuel to Geopolitical Fragmentation
Which countries and regions decreased, banned, or increased Russian oil imports following the 2022 invasion of Ukraine?
-
Politics2 years ago
The Start of De-Dollarization: China’s Gradual Move Away from the USD
The de-dollarization of China’s trade settlements has begun. What patterns do we see in USD and RMB use within China and globally?
-
Politics2 years ago
The Bloc Effect: International Trade with Geopolitical Allies on the Rise
Rising geopolitical tensions are shaping the future of international trade, but what is the effect on trading among G7 and BRICS countries?
-
Green2 years ago
Ranked: Resource Dependency Across 30 Major Economies
High resource dependency in trade makes countries more susceptible to market fluctuations and climate change.
-
Misc2 years ago
Visualizing the Global Education Gap
This graphic adds visual context to the global education gap, using data from 29 major economies.
-
Money3 years ago
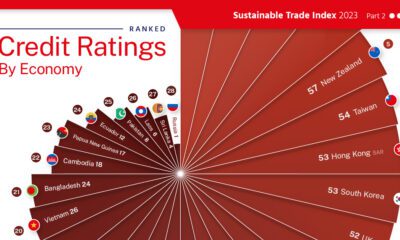
Ranking the Credit Ratings of Major Economies
This graphic visualizes 30 country’s credit ratings, using data from the 2023 Sustainable Trade Index.
-
Economy3 years ago
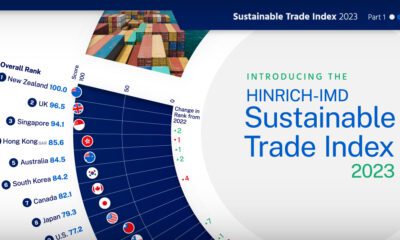
Ranked: The World’s Most Sustainable Economies in 2023
The Sustainable Trade Index 2023 is an annual ranking of the world’s most sustainable economies. View this infographic to see the results.
-
Economy3 years ago
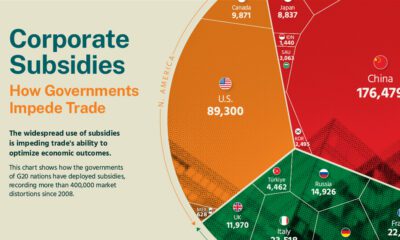
Visualizing the Impact of the G20’s Corporate Subsidies
The Hinrich Foundation visualizes the impact of corporate subsidies by G20 nations between 2008 and Q1 2023.
-
Economy3 years ago
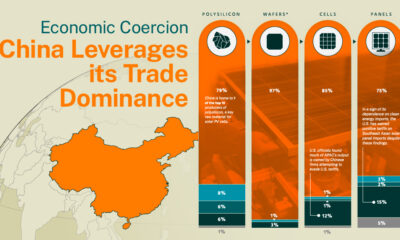
Economic Coercion: China’s Leverage in Trade
The Hinrich Foundation explores China’s use of economic coercion and the implications of its control over the solar energy sector.
-
Politics3 years ago
Ranking the Trade Policies of the G20
We analyze recent trade policies implemented by G20 members to determine whether they are liberalizing or harmful.
-
Green3 years ago
Global Carbon Markets: Highlights from the Latest Report
We highlight key findings from the Hinrich Foundation’s latest report on carbon markets, produced in partnership with Visual Capitalist.
-
Green3 years ago
Ranked: Air Pollution by Economy
Which economies have hazy air, and which ones enjoy mostly clear skies? Find out in this geographic breakdown of air pollution levels.
-
Politics3 years ago
Mapped: Geopolitical Risk by Economy
Prior to invading Ukraine, Russia had one of the highest levels of geopolitical risk. How does geopolitical uncertainty vary around the world?
-
Economy3 years ago
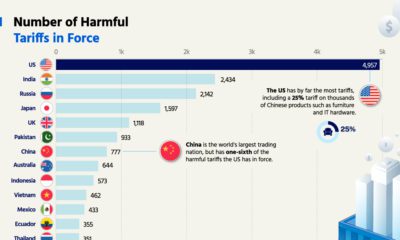
Ranked: Harmful Tariffs by Economy
The U.S. has by far the most harmful tariffs, with nearly 5,000 in force. Which economy has the least tariffs?
-
Business3 years ago
Interested in a Career in Global Trade?
Global trade is growing across regions and countries which is creating an explosion in new jobs and education opportunities.
-
Economy3 years ago
Introducing the 2022 Sustainable Trade Index
See which economies have the most sustainable trade policies in the Hinrich Foundation’s 2022 Sustainable Trade Index.
-
Economy4 years ago
Global Trade Series: Fragmentation in the Digital Economy
In this infographic, we examine the current state of digital fragmentation and it’s implications on the world.
-
Economy4 years ago
Global Trade Series: Asia’s Digital Economy
Asia’s digital economy is expanding quicker than ever, but cooperation between governments is needed to reduce barriers.
-
Economy4 years ago
Global Trade Series: The Benefits of Free Trade
Free trade is a powerful engine for economic growth, but rising protectionism stands in the way. See what the data says in this infographic.
Subscribe
Please enable JavaScript in your browser to complete this form.Join 375,000+ email subscribers: *Sign Up