Why EVs Are Now Cheaper Than Gas Cars in China
![]()
See this visualization first on the Voronoi app.
Use This Visualization
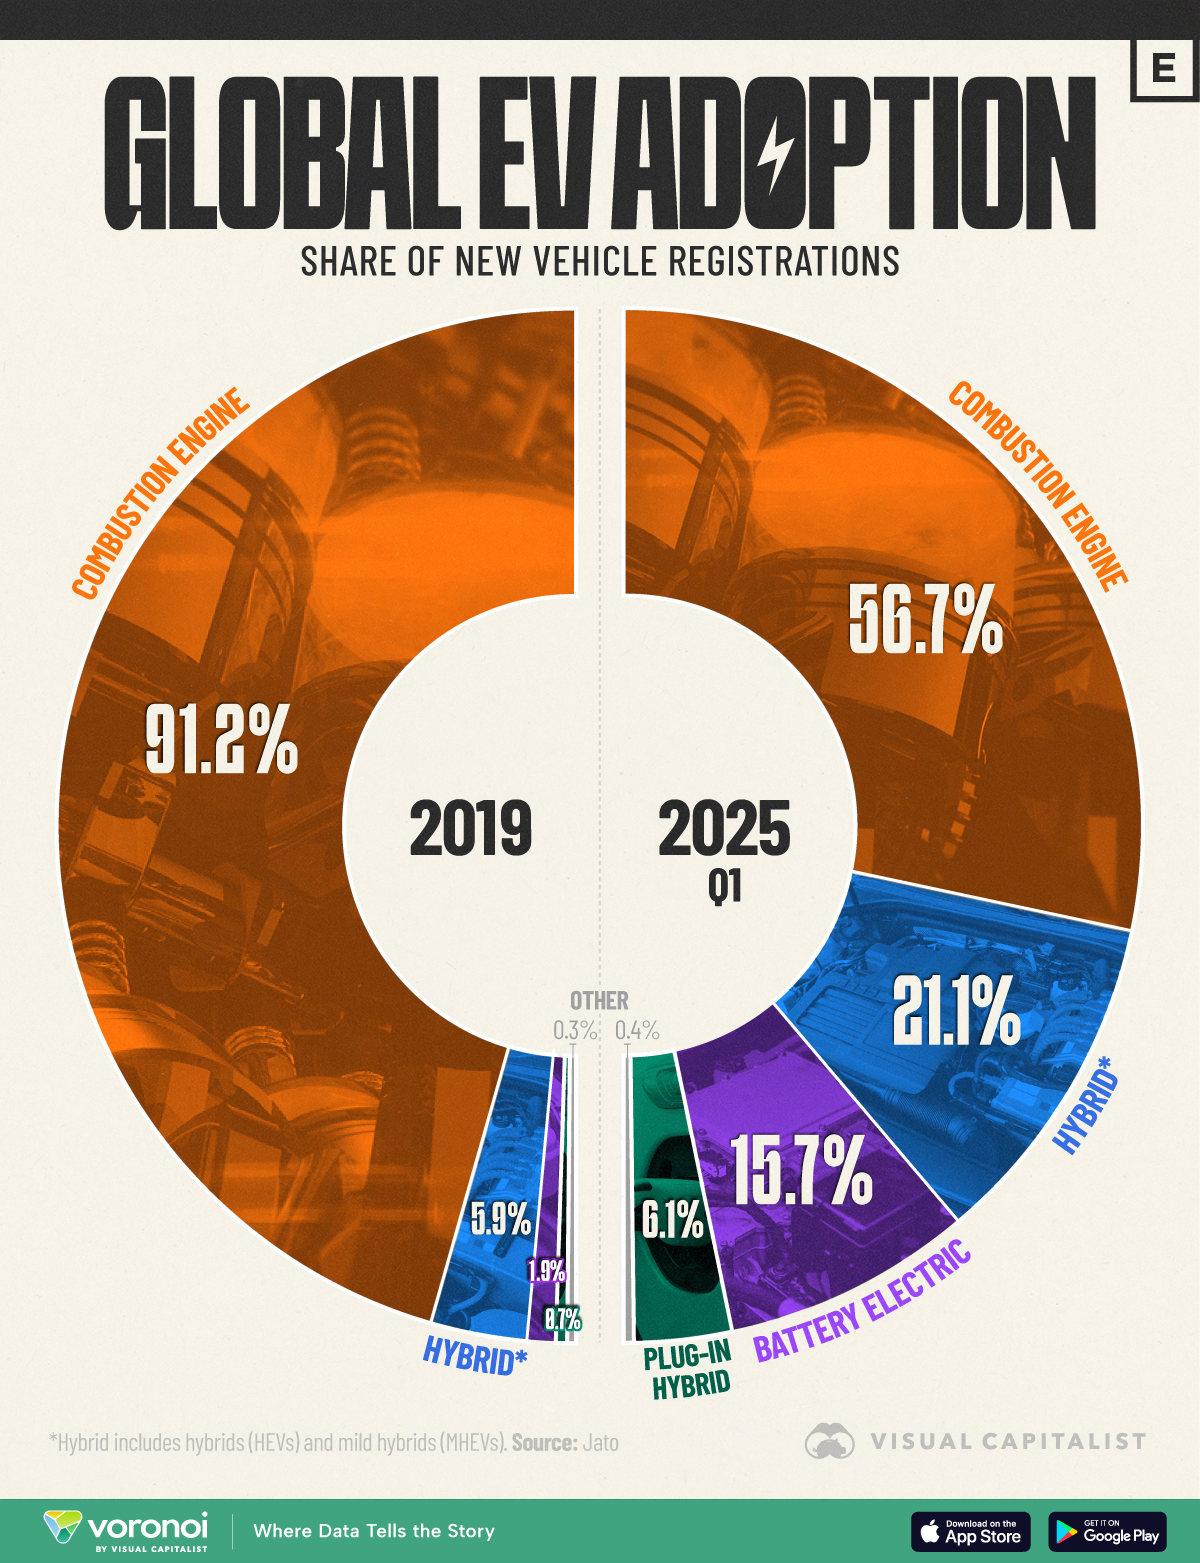
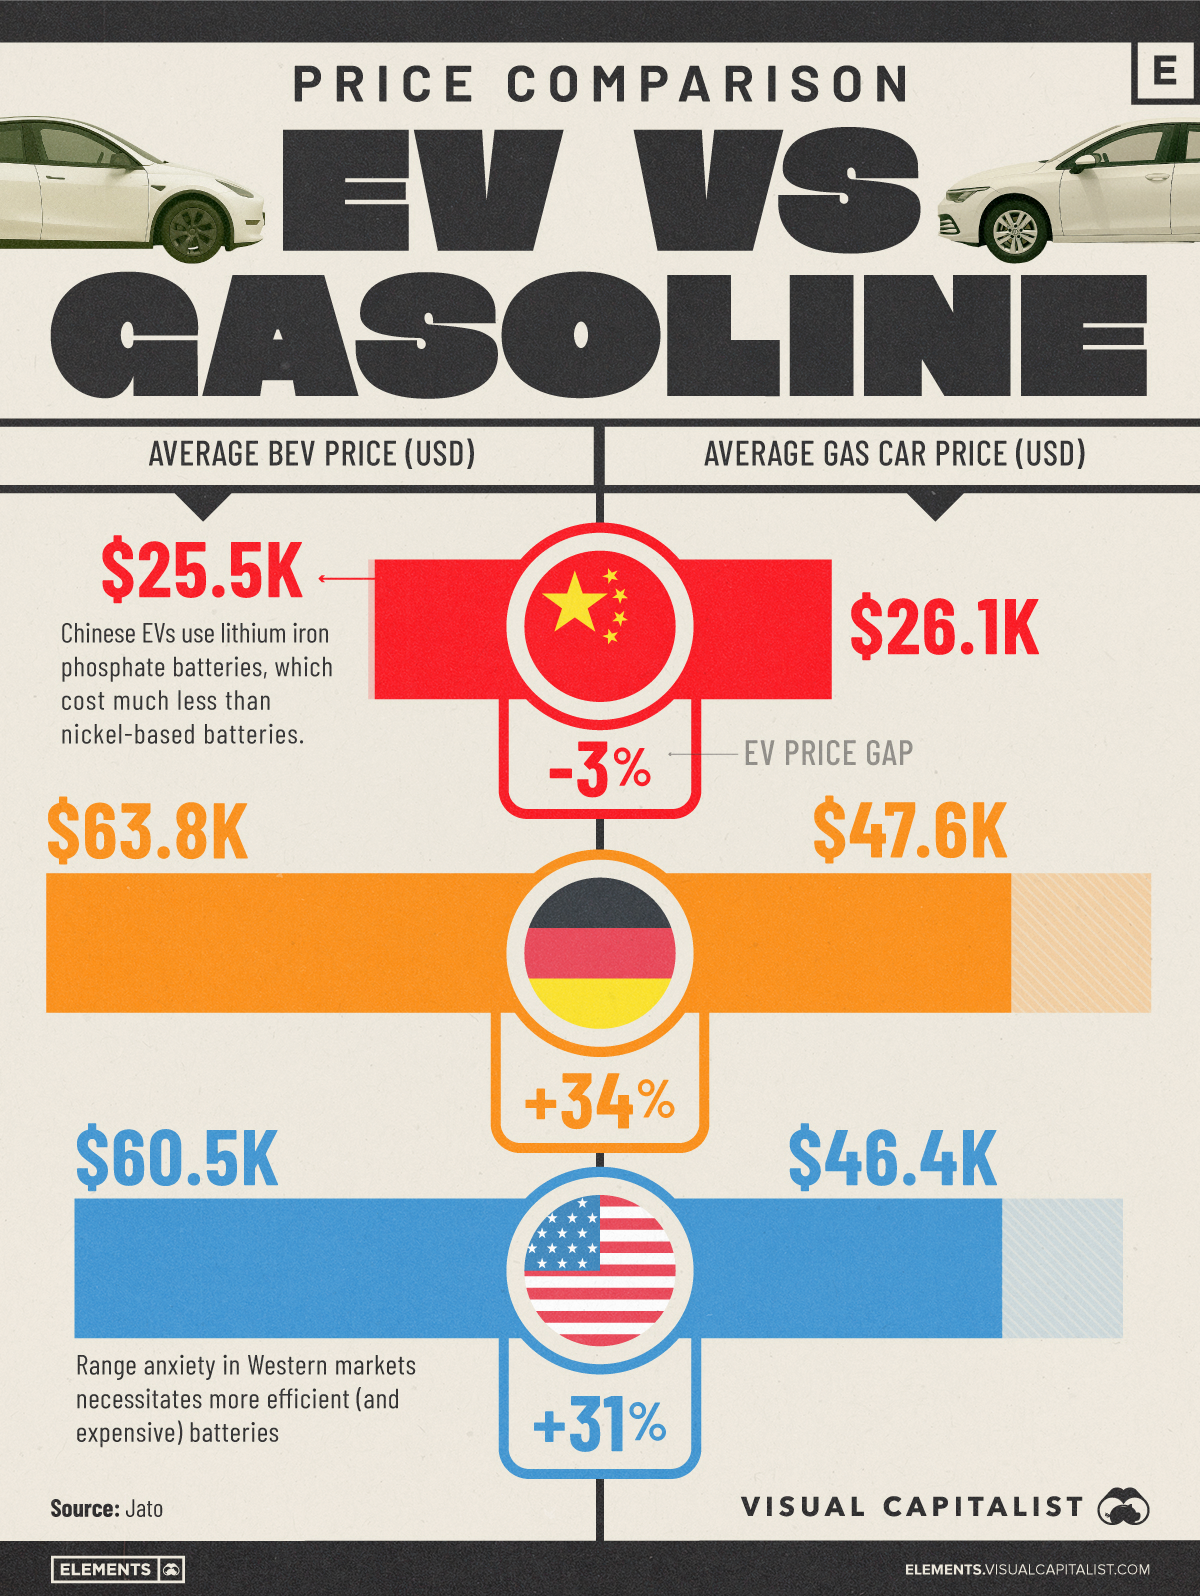
Price Comparison: EVs vs. Gasoline Cars
This was originally posted on our Voronoi app. Download the app for free on iOS or Android and discover incredible data-driven charts from a variety of trusted sources.
Key Takeaways