![]()
See this visualization first on the Voronoi app.
Charted: Apple’s Product Revenue (2007-2023)
This was originally posted on our Voronoi app. Download the app for free on iOS or Android and discover incredible data-driven charts from a variety of trusted sources.
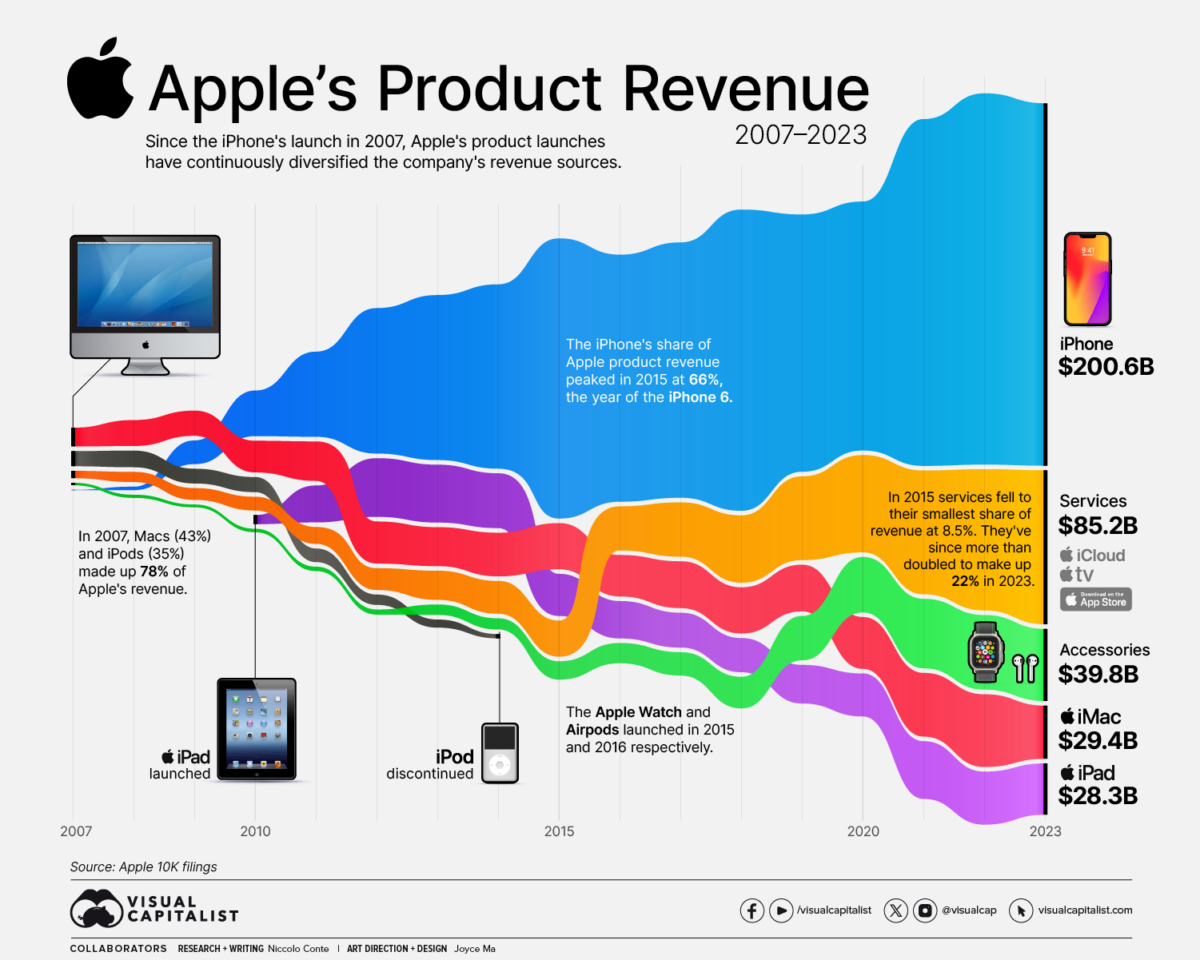
Since the iPhone’s launch in 2007, Apple’s product launches have continuously diversified the company’s revenue sources.
This infographic illustrates Apple’s revenue by product between 2007 and 2023, based on the company’s 10-K filings for the period.
iPhone: A Top-Selling Icon of All Time
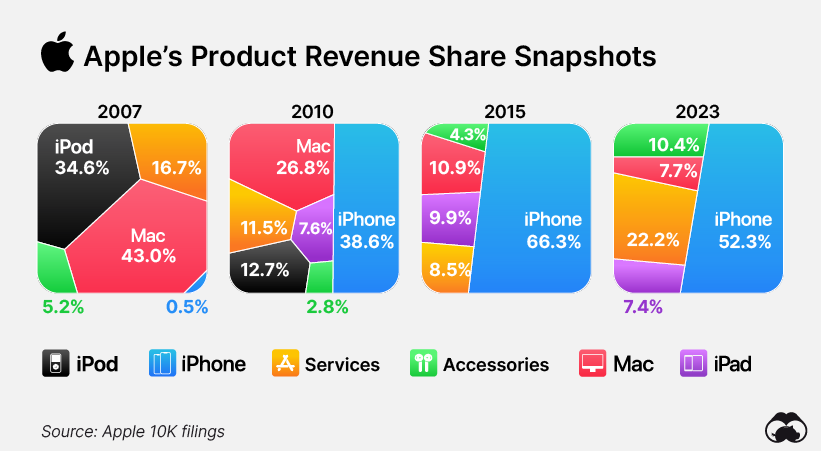
When Apple introduced the iPhone in 2007, Steve Jobs labeled it a “revolutionary product”. That same year, the phone represented just 0.5% of the company’s total revenue. Today, it corresponds to over half of it.
Initially sold exclusively through AT&T for $499, it has since become the company’s most profitable product and one of the world’s most popular phones, with over 2.3 billion units sold and a user base of over 1.5 billion active users.
In 2015, the iPhone’s share of Apple product revenue peaked at 66%, coinciding with the release of the iPhone 6.
| Apple Revenue | iPhone | Accessories | Mac | iPad | iPod | Services |
|---|---|---|---|---|---|---|
| 2007 | $0.1B | $1.2B | $10.3B | - | $8.3B | $4.0B |
| 2008 | $1.8B | $1.6B | $14.2B | - | $9.1B | $5.5B |
| 2009 | $13.0B | $1.4B | $13.8B | - | $8.0B | $6.4B |
| 2010 | $25.2B | $1.8B | $17.5B | $4.9B | $8.3B | $7.5B |
| 2011 | $47.0B | $2.3B | $21.8B | $20.4B | $7.4B | $9.7B |
| 2012 | $80.5B | $2.8B | $23.2B | $32.4B | $5.6B | $11.9B |
| 2013 | $91.8B | $5.7B | $21.5B | $31.9B | $4.4B | $16.0B |
| 2014 | $101.9B | $6.1B | $24.1B | $30.3B | $2.3B | $18.1B |
| 2015 | $155.0B | $10.1B | $25.5B | $23.2B | - | $19.9B |
| 2016 | $136.7B | $11.1B | $22.8B | $20.7B | - | $24.5B |
| 2017 | $141.3B | $12.9B | $25.8B | $19.2B | - | $29.9B |
| 2018 | $166.7B | $17.4B | $25.5B | $18.8B | - | $37.1B |
| 2019 | $142.3B | $24.5B | $25.7B | $21.2B | - | $46.3B |
| 2020 | $137.8B | $30.6B | $28.6B | $23.7B | - | $53.7B |
| 2021 | $191.9B | $38.4B | $35.1B | $31.9B | - | $68.4B |
| 2022 | $205.5B | $41.2B | $40.2B | $29.3B | - | $78.1B |
| 2023 | $200.6B | $39.8B | $29.3B | $28.3B | - | $85.2B |
Apple has also experienced a shift in the share of revenue originating from its Mac division. In 2007, Macs represented 43% of the company’s revenue, while iPods accounted for 35%.
Since 2015, however, services and accessories/wearables (such as the Apple Watch and AirPods) have contributed increasingly to the company’s revenue shares. Mac revenue declined by 27% year over year in 2023, making up only 8% of Apple’s total revenue.
More recently, the growth of services and accessories/wearables has started to slow down, mirroring trends seen in other product lines.
Perhaps the next question for the company is whether the Apple Vision Pro, a wearable computer that projects output directly into the eyes and is primarily controlled through eye tracking and gestures, will become a consistent source of revenue and product line.
The post Charted: Apple’s Product Revenue (2007-2023) appeared first on Visual Capitalist.