
Authored by Kevin Muir via The Macro Tourist blog,
The other day I stumbled upon this great tweet from Holger Zschaepitz, the senior editor of the financial desk of the German newspaper, Die Welt.

I have often said the last thing any equity bull should hope for is a strong economy, especially one accompanied with an uptick in inflation. A near perfect nirvana environment would be one with low inflation and, decent, but not exploding growth. And low and behold, this is exactly what Europe is experiencing.

Inflation is stumbling just enough for the ECB to err on slowing the pace of their tapering, but meanwhile, the economy is ticking slightly above expectations. What’s the result of this combination? Quantitative easing for slightly longer. Nothing like the Central Bank goosing financial markets higher with more blue tickets.
If the economy and inflation were both running a percentage point higher, what do you think would be the ECB’s response? They would be tapering (and maybe even tightening) at a much quicker pace. So ironically, a slightly below target economy could well be the absolute best environment for stocks. When Holger describes the current EU economic numbers as Goldilocks, I must admit, I concur completely.
Shadow rates
Over the past decade, as more and more countries have adopted ZIRP (zero interest rate policy), with some even pushing down to NIRP (negative interest rate policy), economists have struggled with a way to measure the degree of accommodation that their unconventional policies were exerting on the economy. First introduced by Fisher Black in 1995, the concept of a shadow rate gained widespread adoption in days following the 2008 Great Financial Crisis. There are various models, with the Wu-Xia model gaining prominence in the United States. However, the Reserve Bank of New Zealand has created models for a wider swath of countries, and these series are rising in popularity.
Although the math for these shadow rates is complicated, the important thing to realize is that if rates are positive, shadow rates are essentially the same as the actual rate. But when rates hit zero (or below), the shadow rate measures the theoretical negative rate. Even though US rates never went below zero in the last cycle, the shadow rate was deep into negative territory at the height of Bernanke’s quantitative easing madness.
If we combine inflation to these short-term shadow rates, we get a crude sense of the real rate. This is the amount that monetary policy is set above or below inflation.
Let’s have a look at these variables for the European economy over the past couple of decades.
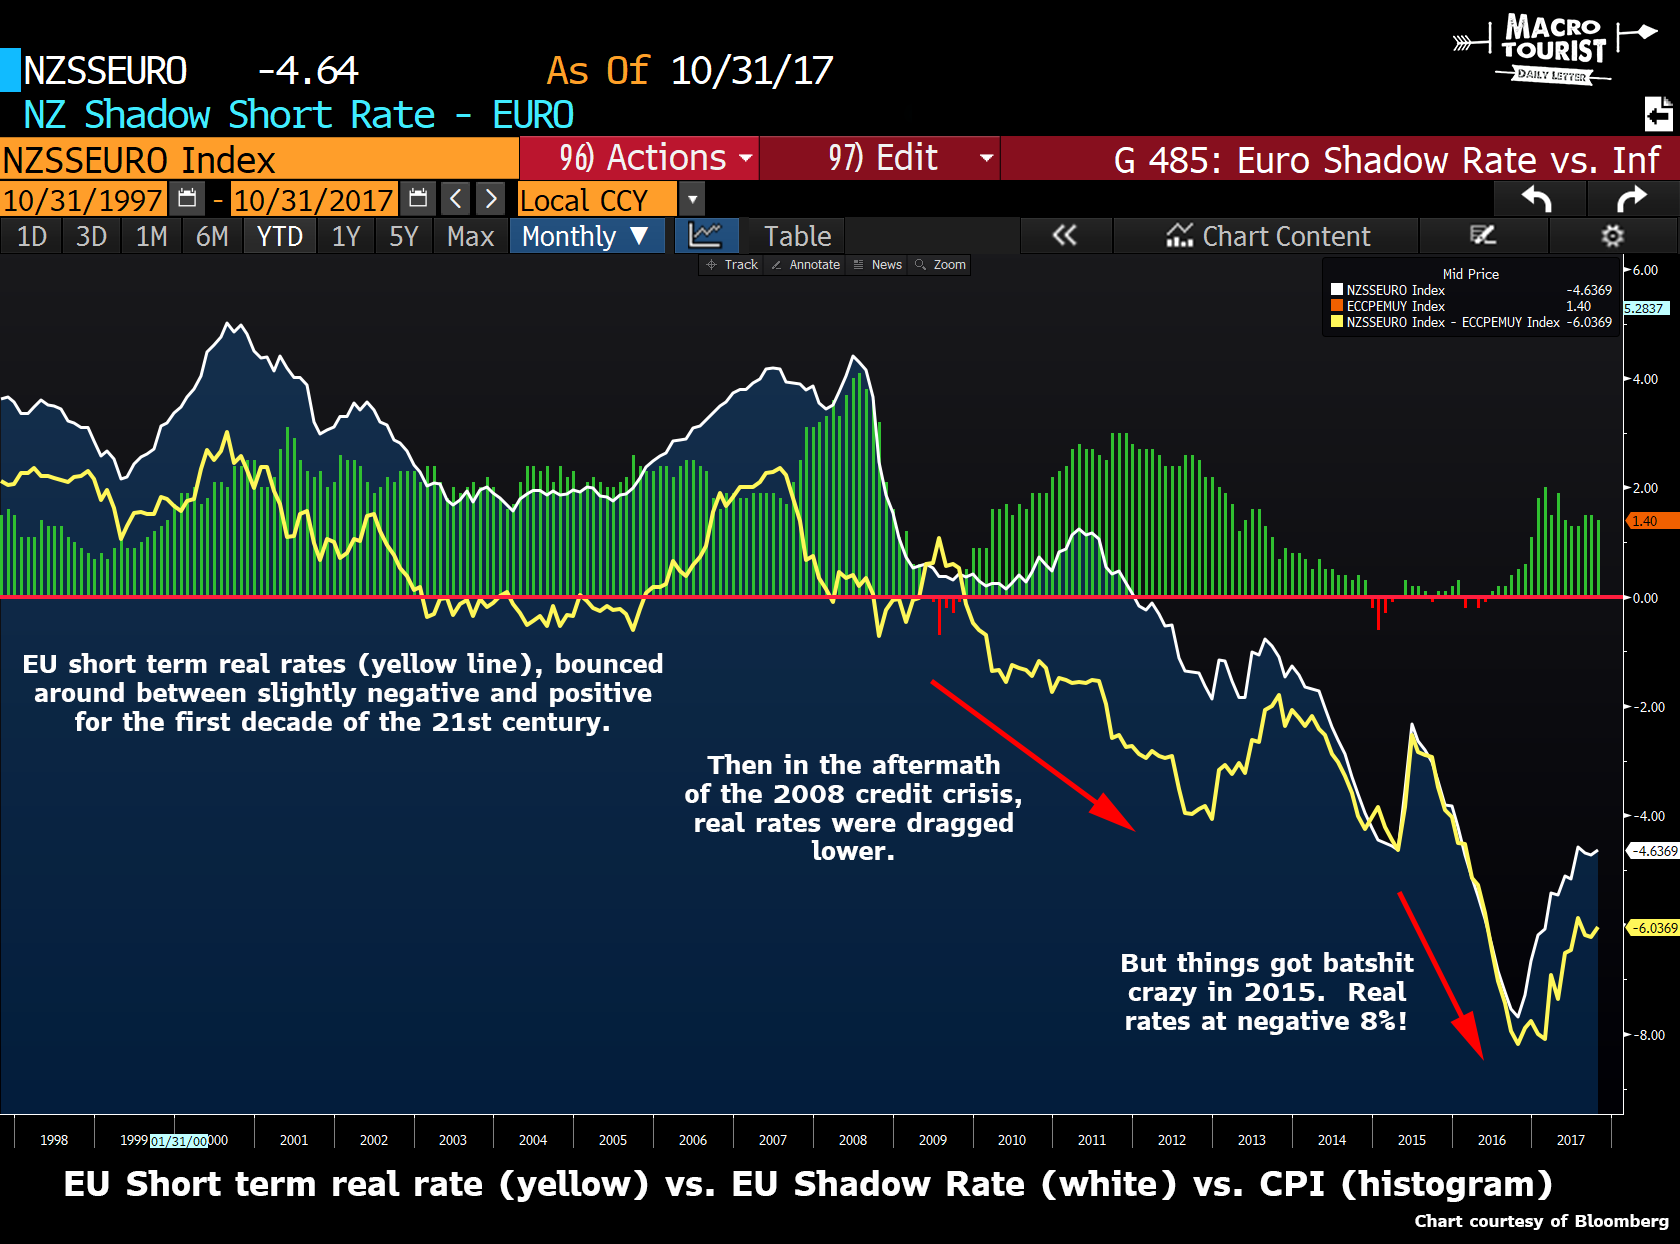
From 1997 to 2008, the real rate drifted around between 2% and -0.50%. But then look what happened after 2008. Real rates broke down and fell deeply into negative territory. If you look closely at the white line, the shadow rate, you will notice that it wasn’t until 2011 that it broke zero. But then over the next half dozen years, the shadow rate went from 0% all the way down to minus 8%! Think about that for a second. According to this model, the actual short-term rate is minus 8%! I know I am repeating myself, but it bears repeating. That’s nuts.
At the time, inflation was basically zero, so the real rate was also minus 8%.
Nutball Mario, right? Well, not so fast. Here is the same graph for the United States.
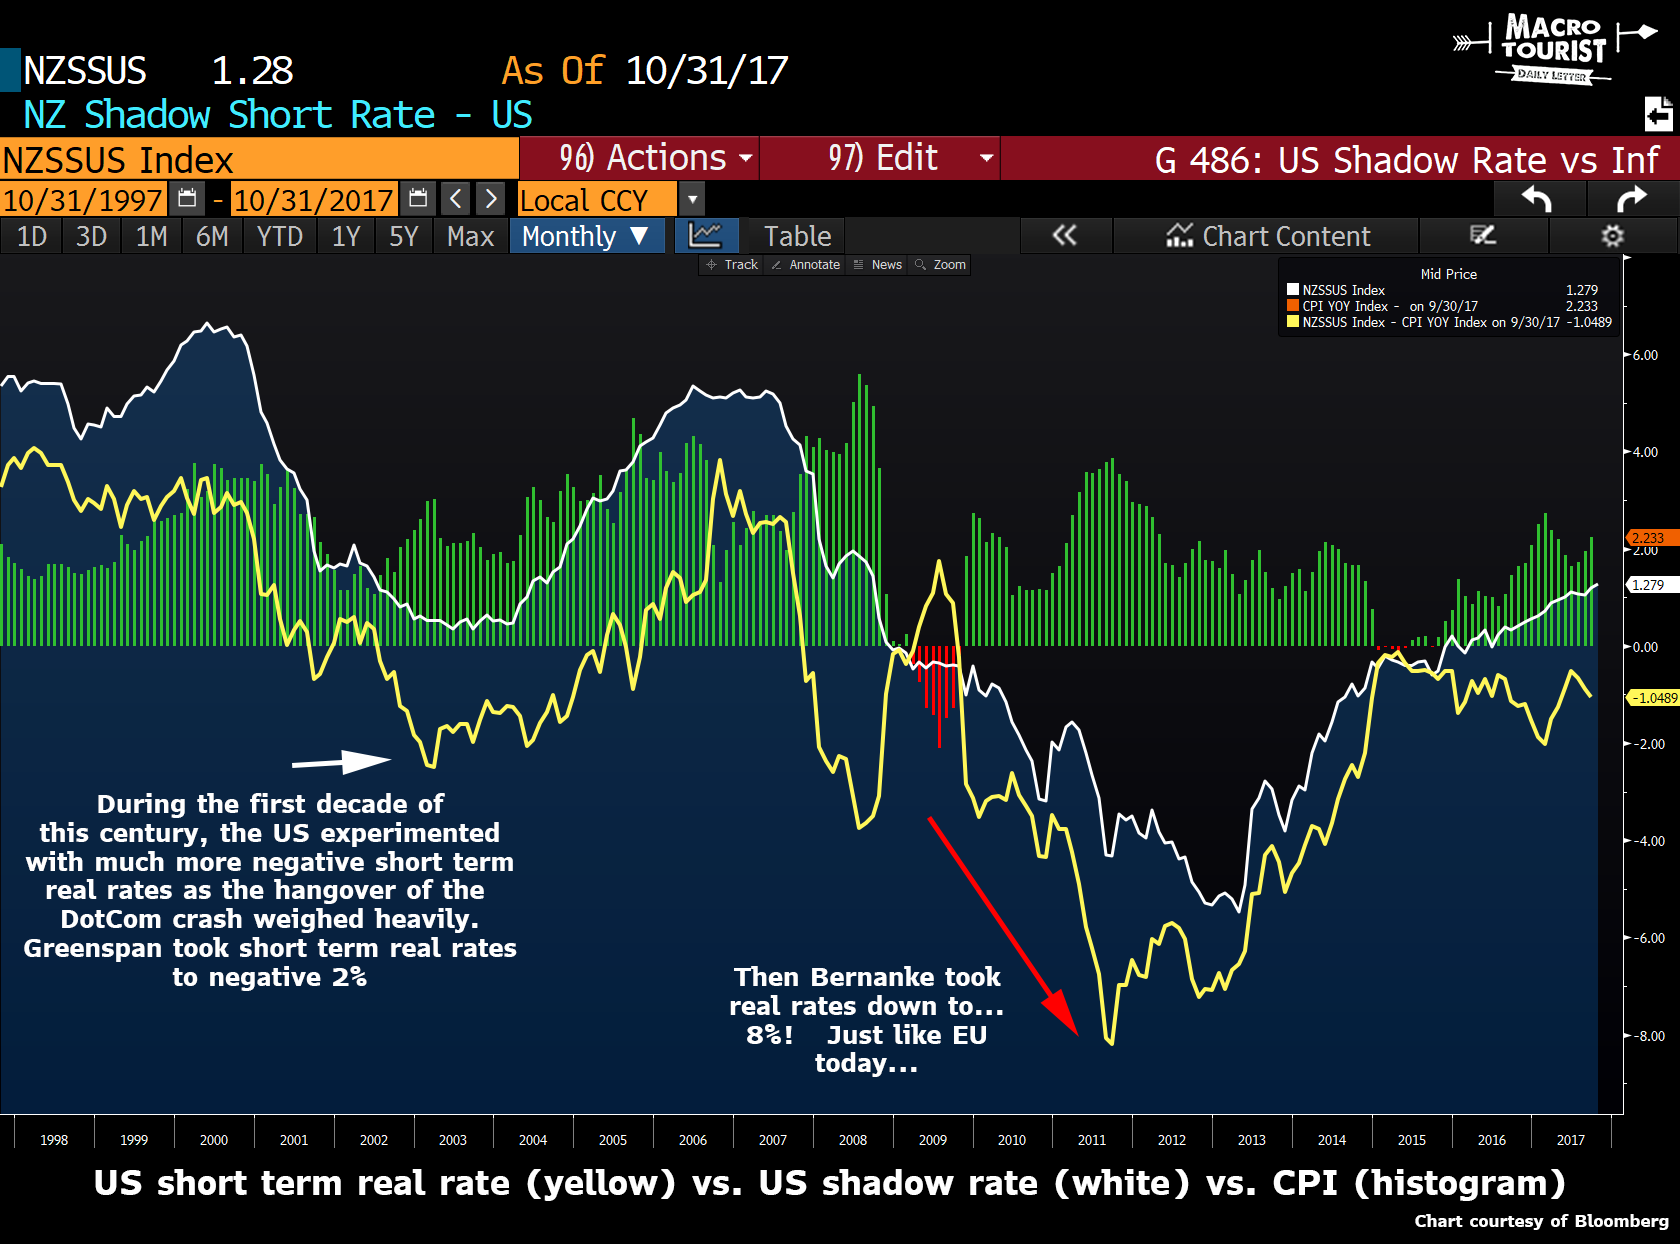
Look closely at the period around 2011. Although the shadow rate only declined to minus 5%, inflation was running positive. Therefore in the depths of the quantitative easing, the real rate bottomed at minus 8%! Coincidence?
What has happened to the US stock market since that crazy monetary extreme? It’s rocketed higher.
I know there are differences between the US and Europe, and there is much more than just monetary policy to factor into an investment decision, but sometimes it’s just this easy. Monetary policy acts with a long lag. In the years following Bernanke’s stimulus, investors were skeptical of the American stock market rally, but it kept going, and going, and going. My guess is that the same will happen with Europe today. They are just a few years behind the Americans.
Just like Japan
The current situation in Europe reminds me a lot of Japan from a couple of months ago. I remember the Nikkei breaking out, and even though it was a clean chart pattern, tons of investors had all sorts of reasons why Japanese stocks wouldn’t rise.
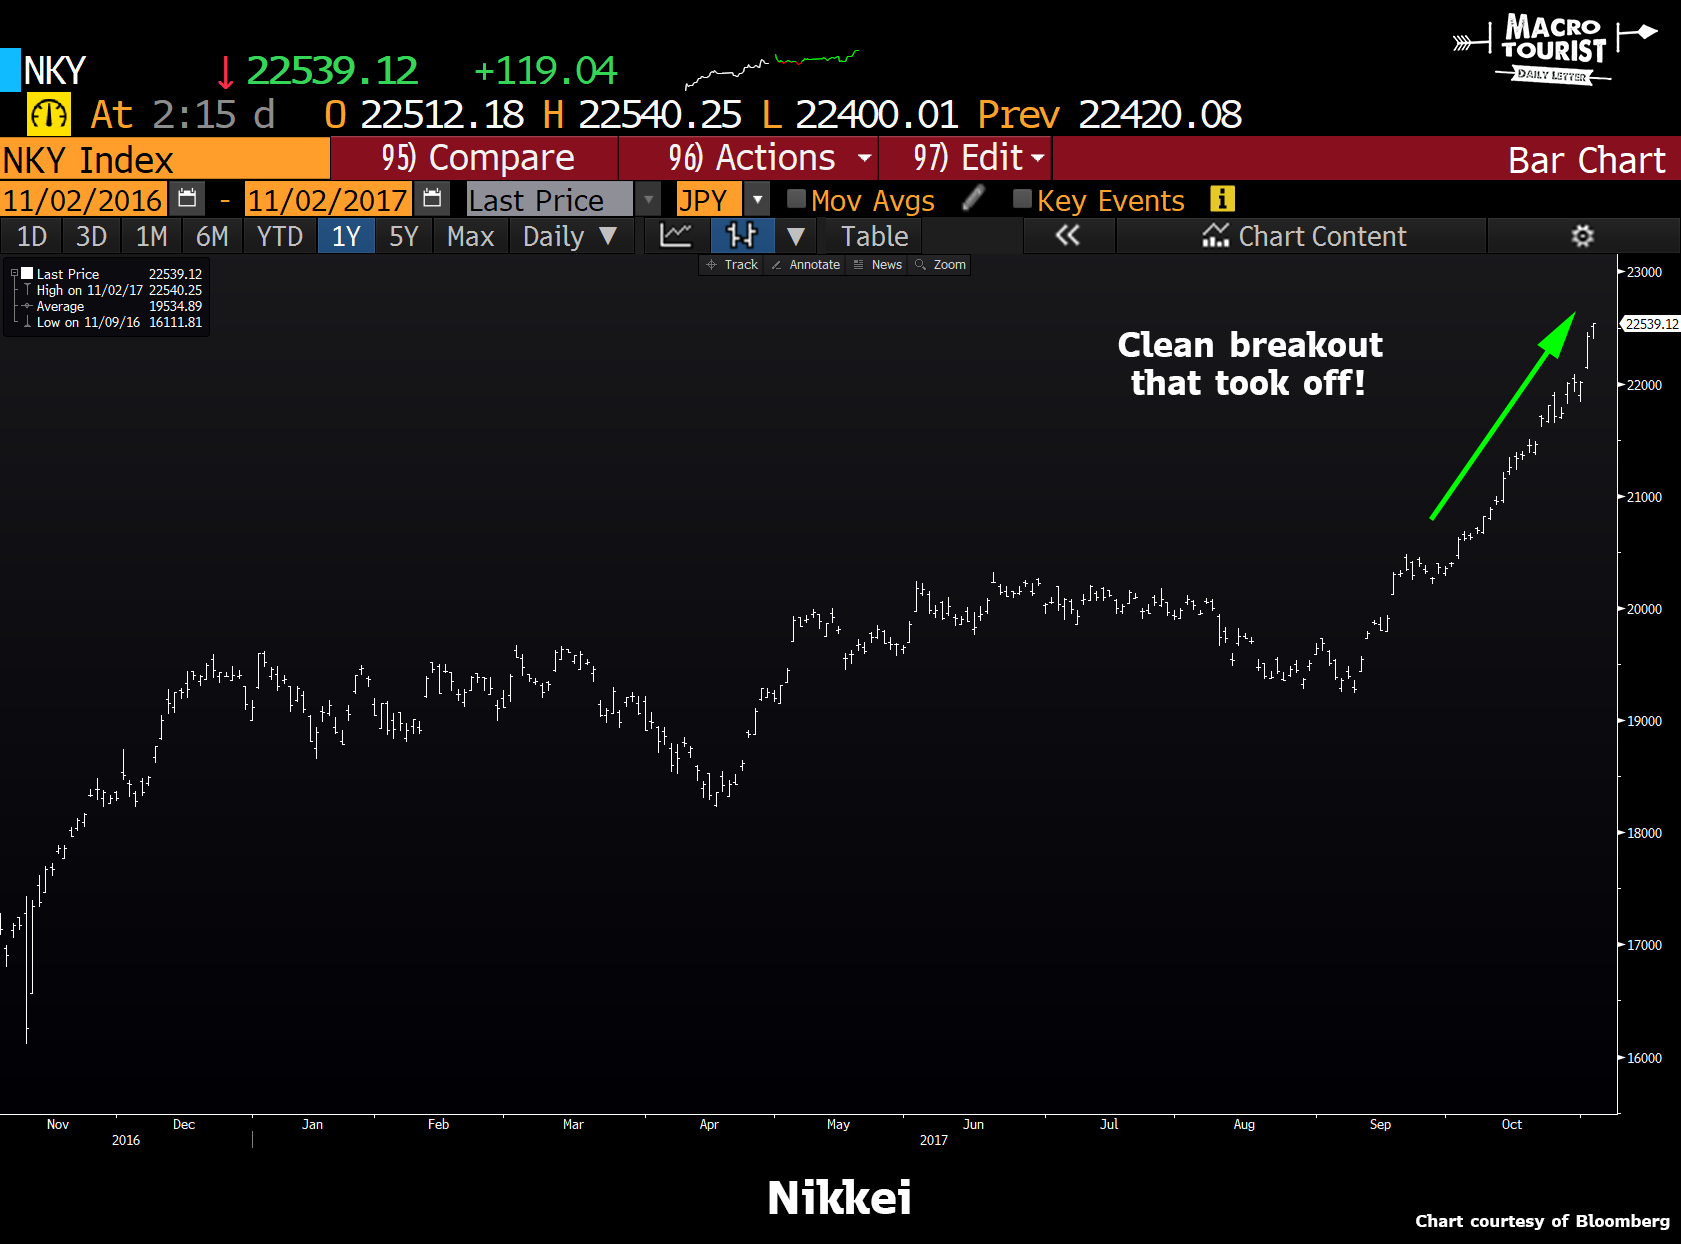
The rally was quiet, and filled with skepticism.
Well, I suspect there is a good chance the same thing will happen in Europe.
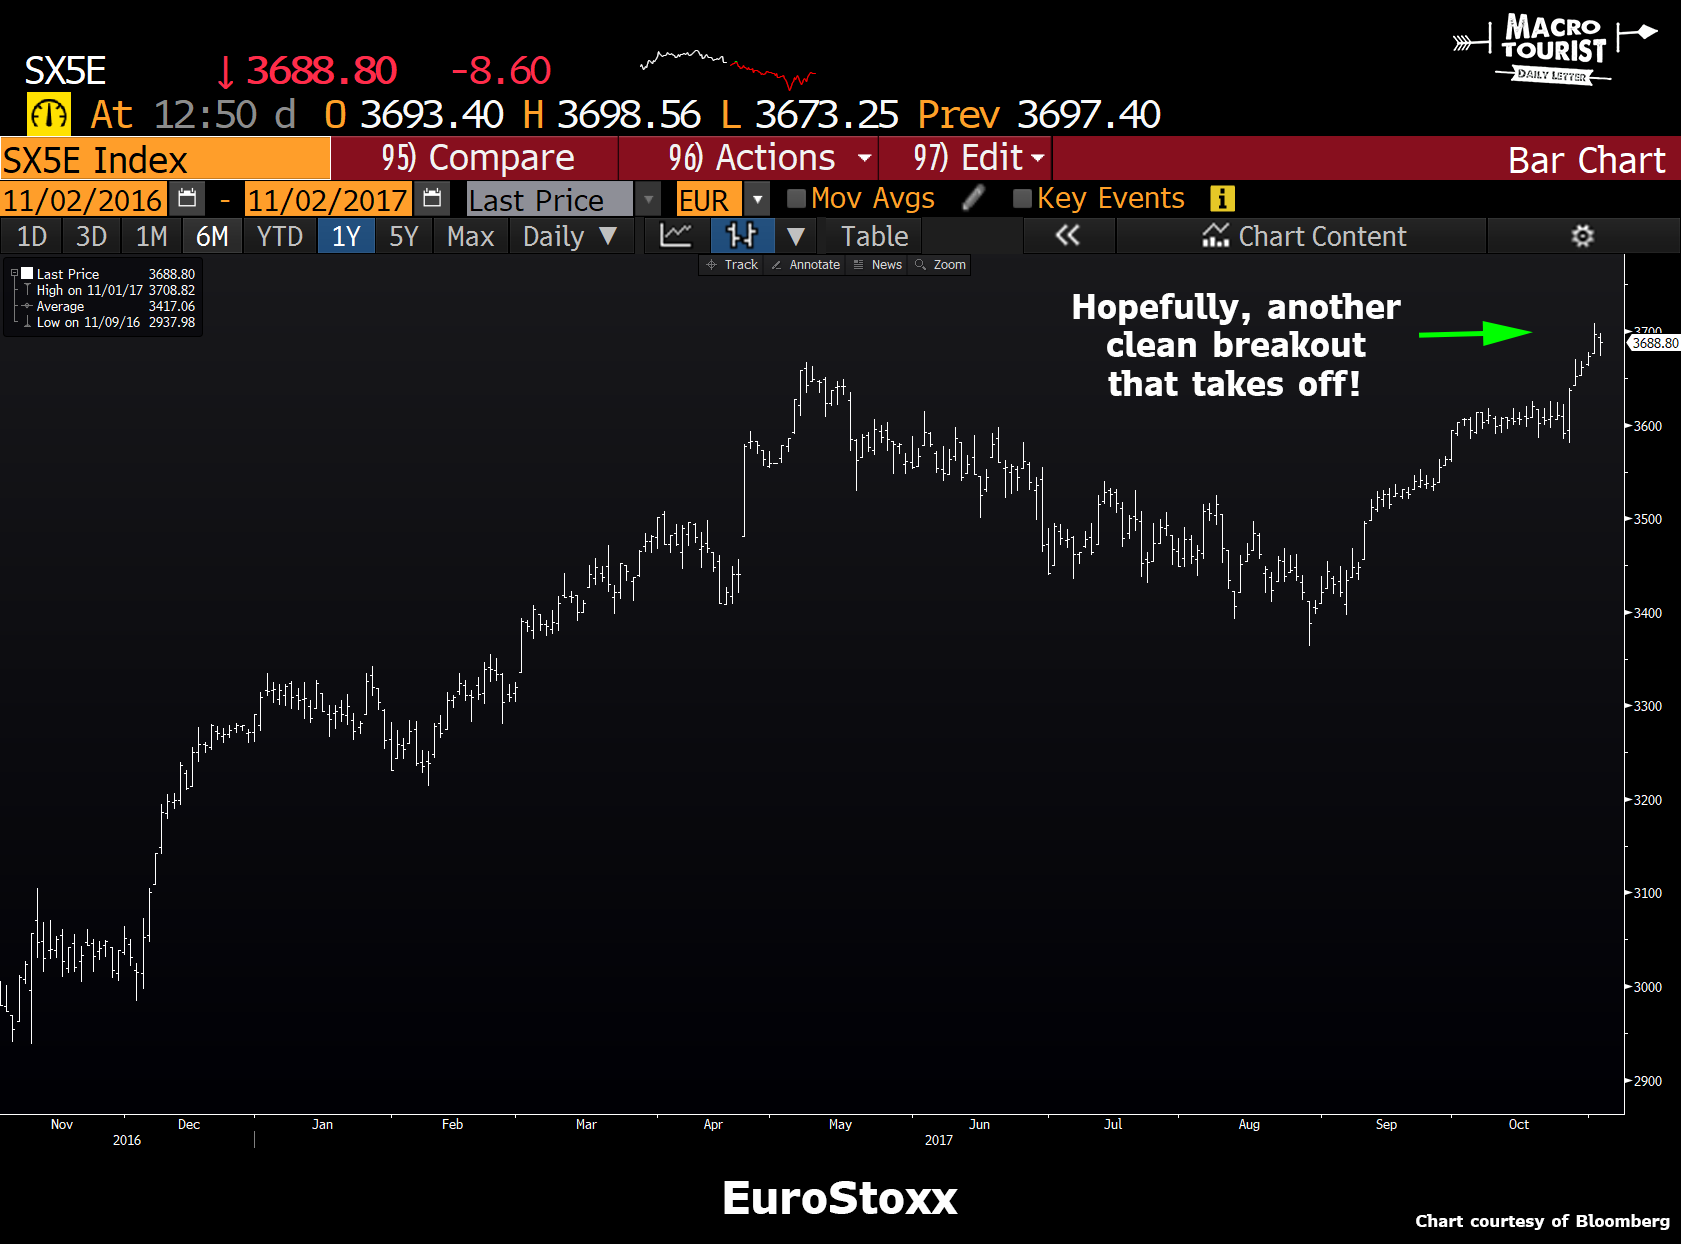
So don’t bother sending me all the reasons why Europe can’t rally, it will only make me think it looks all the more like Japan.
And for those of a more bearish persuasion, I think long European / short US stocks makes tons of sense in here. You have one Central Bank that refuses to ease up on the accelerator, while the other is looking to raise rates more quickly than the market has priced in. If for no other reason than that, it’s worth having a gander at the trade.