Visualizing How Big Tech Companies Make Their Billions
First there was oil, then tobacco, then pharma. The “Big” epithet has always denoted the unique scale and power of certain industries, and today’s Big Tech companies are the perfect example.
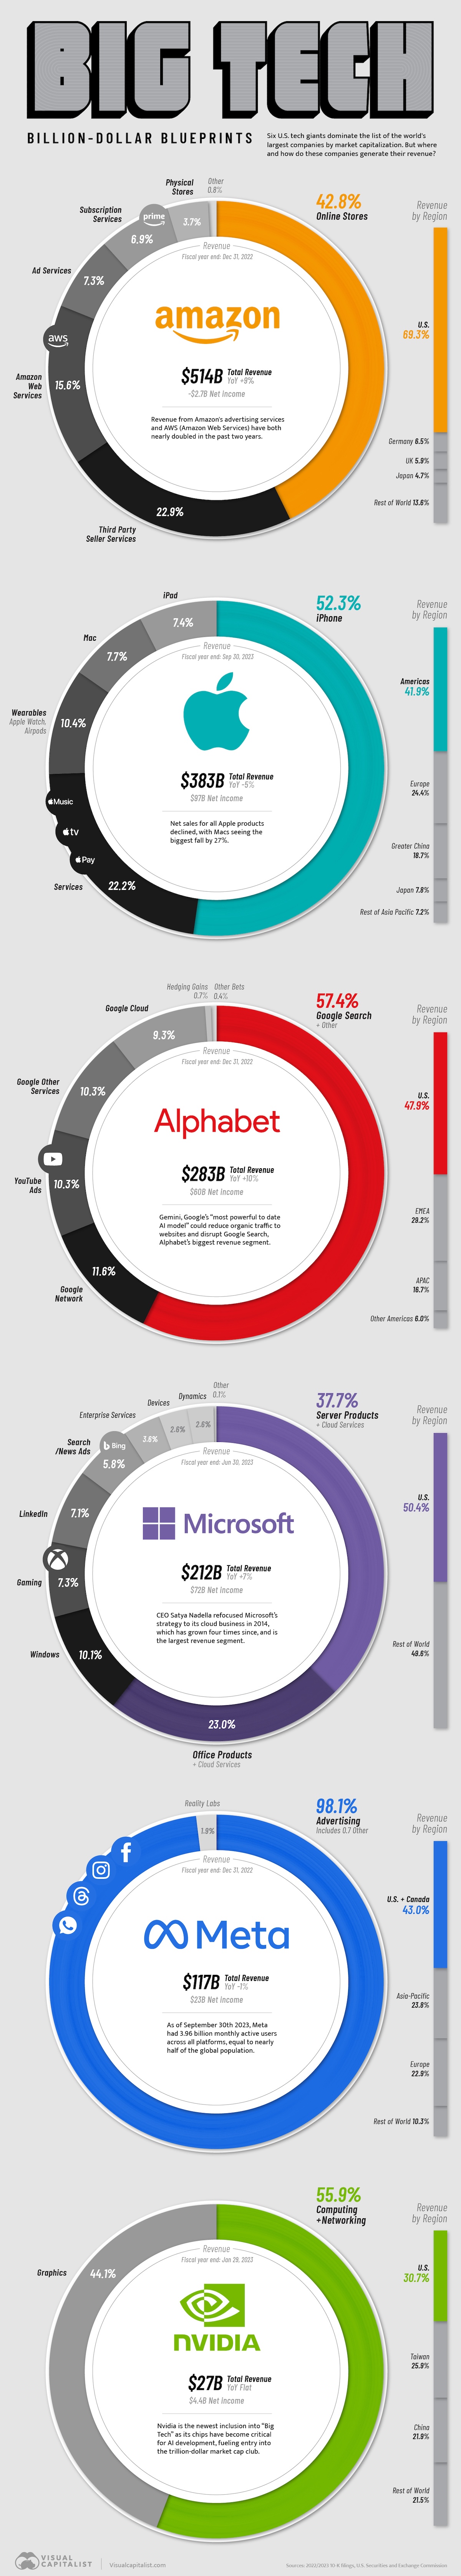
These six tech giants—Alphabet, Amazon, Apple, Microsoft, Meta (formerly Facebook), and Nvidia—are each one of the eight most valuable companies in the world by market capitalization.
Thanks to the ubiquity of their business, they routinely pull in an annual revenue that exceeds many national GDPs. We visualize how and where Big Tech’s revenues came from, per their latest full-year SEC filings.
Big Tech Spotlight: Alphabet, Amazon, and Meta
First we look at Alphabet, Amazon, and Meta, whose financial years ended in December 2022.
Alphabet made slightly north of $280 billion in 2022, nearly 60% of that coming from monetizing Google Search and other related activities.
Their $60 billion profit is the third-highest amongst its Big Tech peers. Their net profit margin (net income divided by total revenue) stood at 21.2% for the year, or 21 cents in profit for every dollar of revenue earned.
Here’s a quick look at the numbers.
| Company | Revenue | Profit | Net Profit Margin | Revenue Change (YoY) |
|---|---|---|---|---|
| Alphabet | $282.8B | $60.0B | 21.2% | 10% |
| Amazon | $514.0B | $-2.7B | -0.5% | 9% |
| Meta | $116.6B | $23.2B | 19.9% | -1% |
At $514 billion, e-commerce giant Amazon logged its highest revenue ever, beating its Big Tech peers by landslide.
However, severance payouts and a $720 million impairment charge (due to shutting some of their physical grocery stores), hurt the company’s bottom-line. Amazon posed a nearly $3 billion net loss for the year, and, consequently, a negative net profit margin (-0.53%).
Meta pulled in close to $117 billion in 2022 and turned a $23 billion profit, for a nearly 20% net margin. Meta’s slight year-on-year revenue decline (-1%) was attributed to foreign exchange movement.
Big Tech Spotlight: Apple, Microsoft, and Nvidia
Apple is an investor darling for a reason. Consider: $383 billion revenue (for financial year ending Sep. 2023) and $97 billion in profit—second-most in the world after oil giant Saudi Aramco.
Finally, Apple’s 25% net profit margin is the second-highest amongst the Big Tech companies.
Nevertheless, even Apple has less-than-stellar years on occasion. Sales for all Apple products declined year-on year, pulling revenue down 5%. The iPhone continues to be the company’s chief moneymaker, contributing 52% of total revenue.
| Company | Revenue | Profit | Net Profit Margin | Revenue Change (YoY) |
|---|---|---|---|---|
| Apple | $383.3B | $97.0B | 25.3% | -5% |
| Microsoft | $211.9B | $72.4B | 34.1% | 7% |
| Nvidia | $27.0B | $4.37B | 15.9% | Flat |
Meanwhile, Microsoft earned nearly $212 billion for its financial year ending July 2023, led by gains in their cloud and server segment, which CEO Satya Nadella prioritized back in 2014.
The company’s $72 billion net income meant the company raked in 34 cents for every dollar it made, the highest profit margin in Big Tech.
Finally, chip-designer Nvidia—the newest entrant into the trillion dollar club—made about $27 billion for the financial year ending January 2023, with a $4 billion profit. Net profit margin stood at 15.9%.
However, the company’s profile amongst investors is rising rapidly, due to its critical position in the growing AI chip business. The company has already registered a more-than-four-fold profit increase in 2023 so far—even without accounting for the last four months of the year.
The post Visualizing How Big Tech Companies Make Their Billions appeared first on Visual Capitalist.