Have Combustion Vehicle Sales Already Peaked?
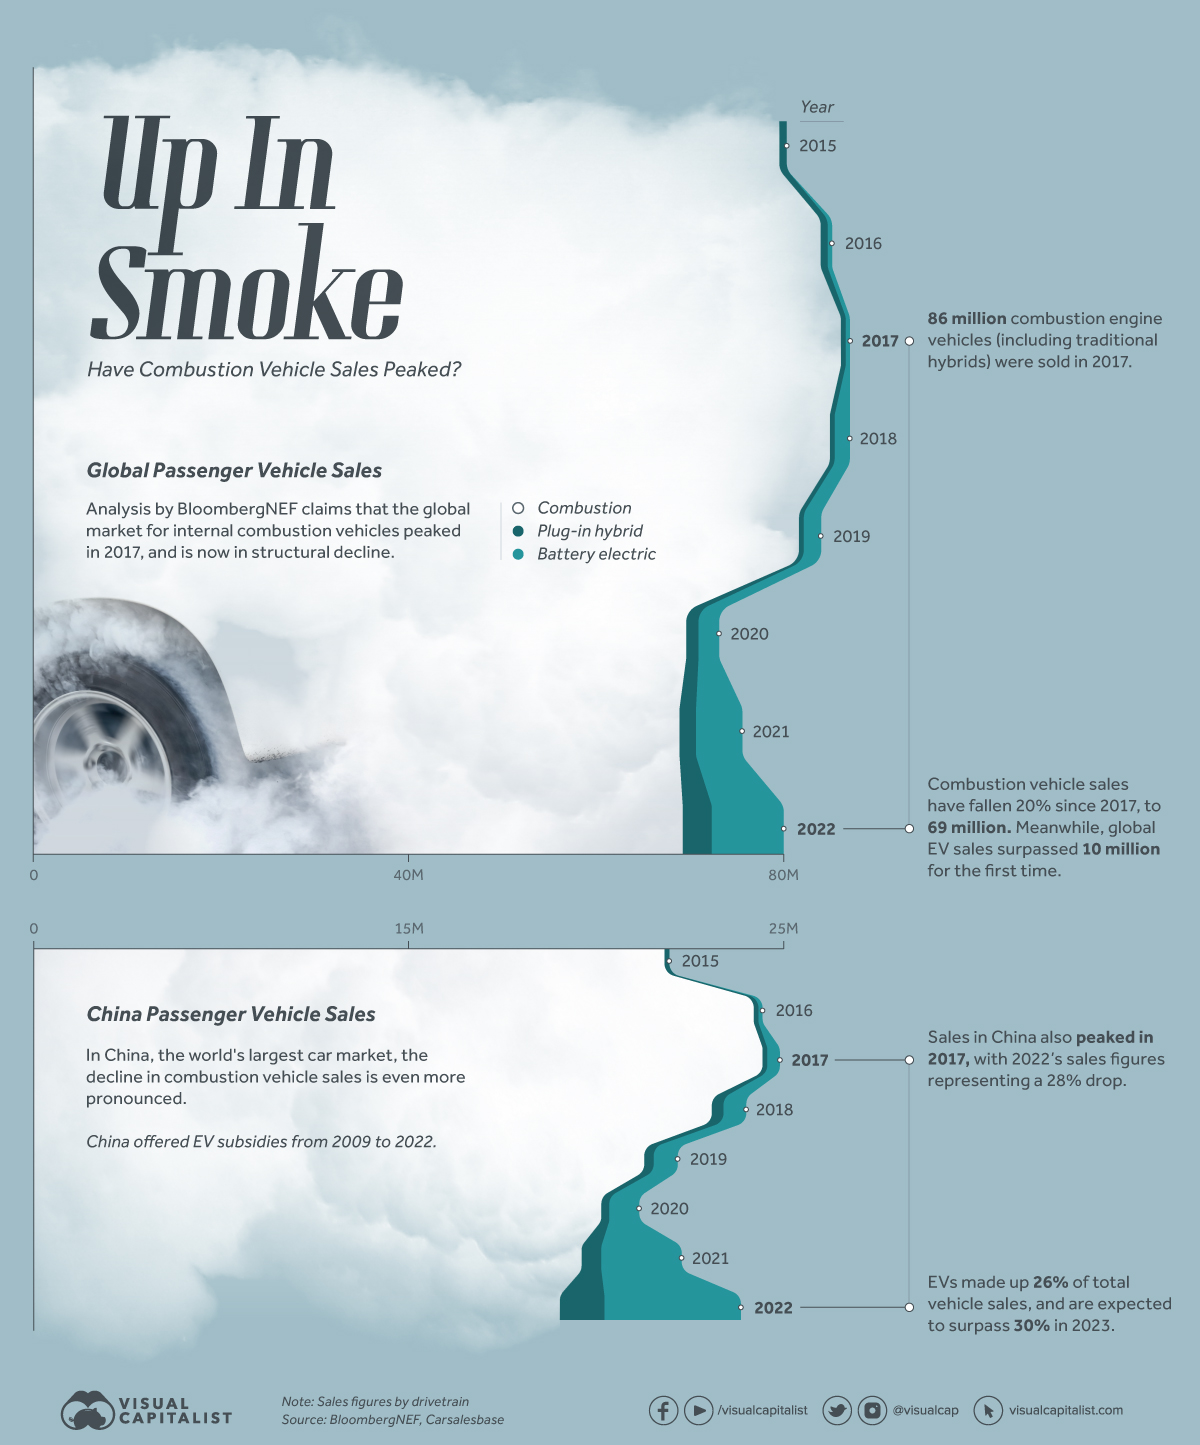
Have Combustion Vehicle Sales Already Peaked?
Electric vehicle (EV) sales have grown rapidly over the past few years, but have they managed to make a dent in the global market?
To find out, we’ve visualized data from BloombergNEF that breaks down annual vehicle sales by three categories: