Charting How U.S. Tariffs Will Hit Key Products

Published
55 mins ago
on
August 19, 2025
| 9 views
-->
By
Julia Wendling
Graphics & Design

Published
55 mins ago
on
August 19, 2025
| 9 views
-->
By
Julia Wendling
Graphics & Design
![]()
See this visualization first on the Voronoi app.

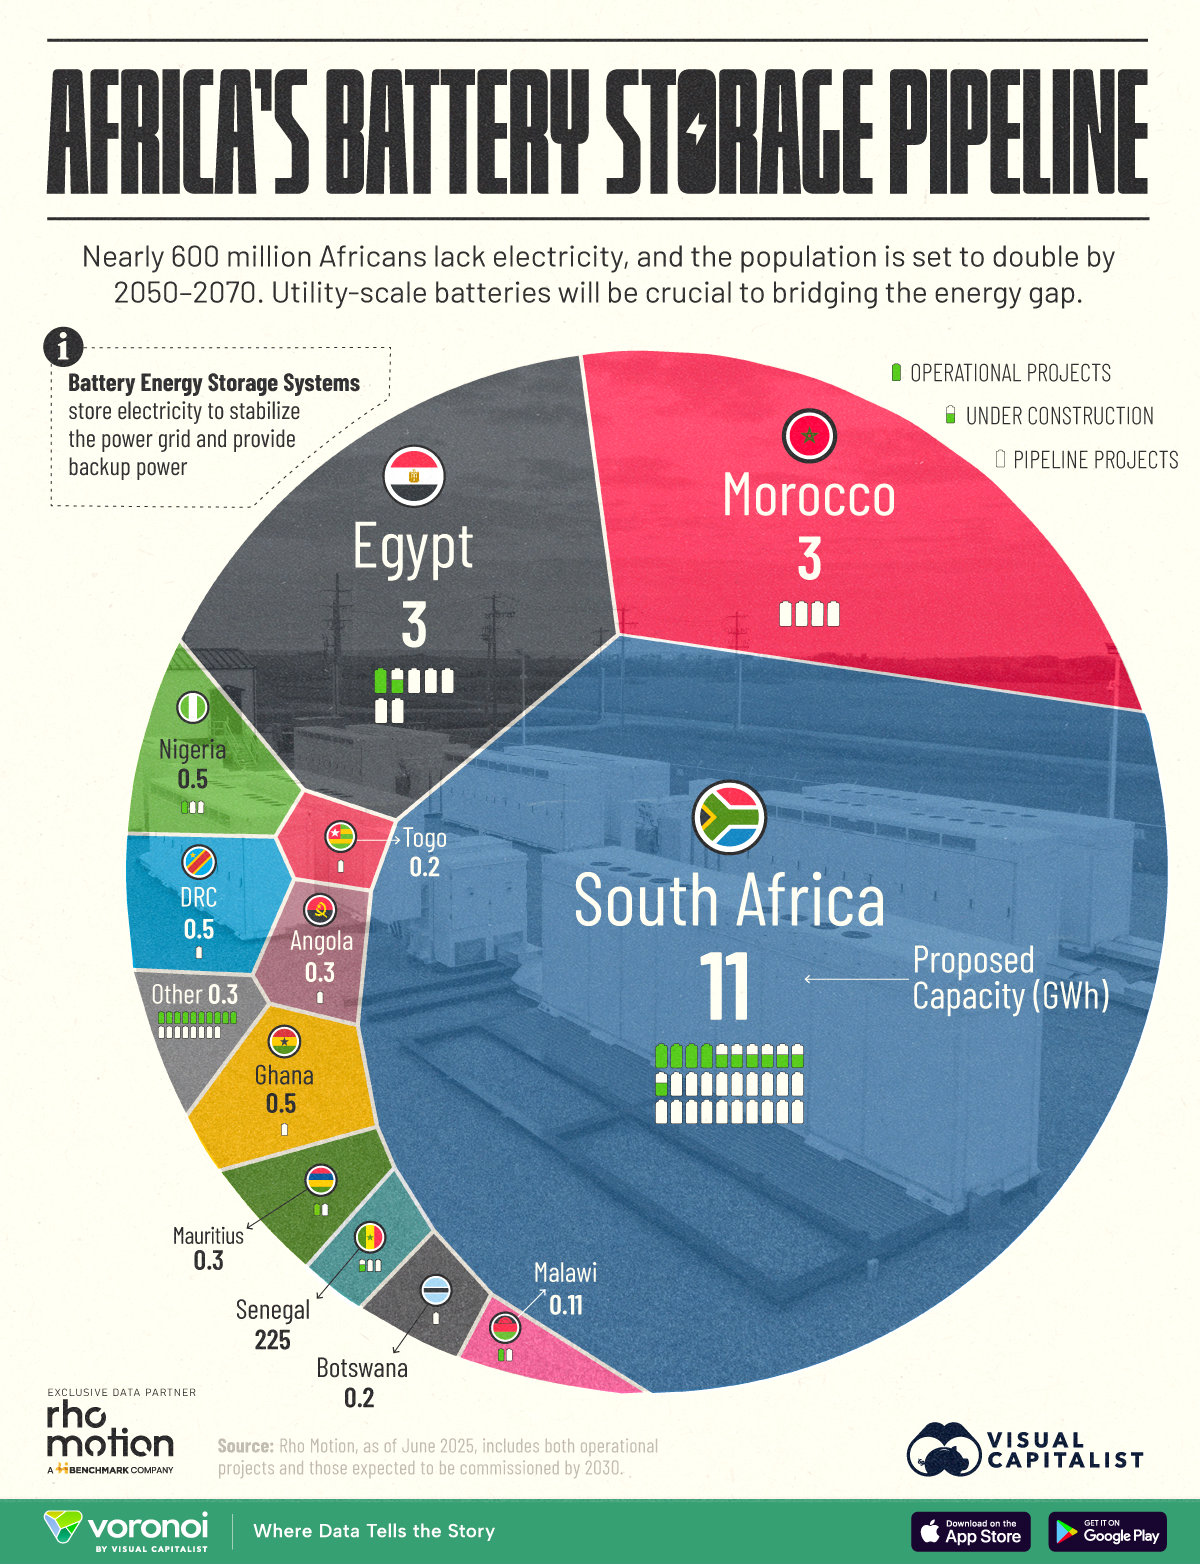
Visualizing Africa’s Battery Storage Pipeline
This was originally posted on our Voronoi app. Download the app for free on iOS or Android and discover incredible data-driven charts from a variety of trusted sources.
Key Takeaways
![]()
See this visualization first on the Voronoi app.

Use This Visualization
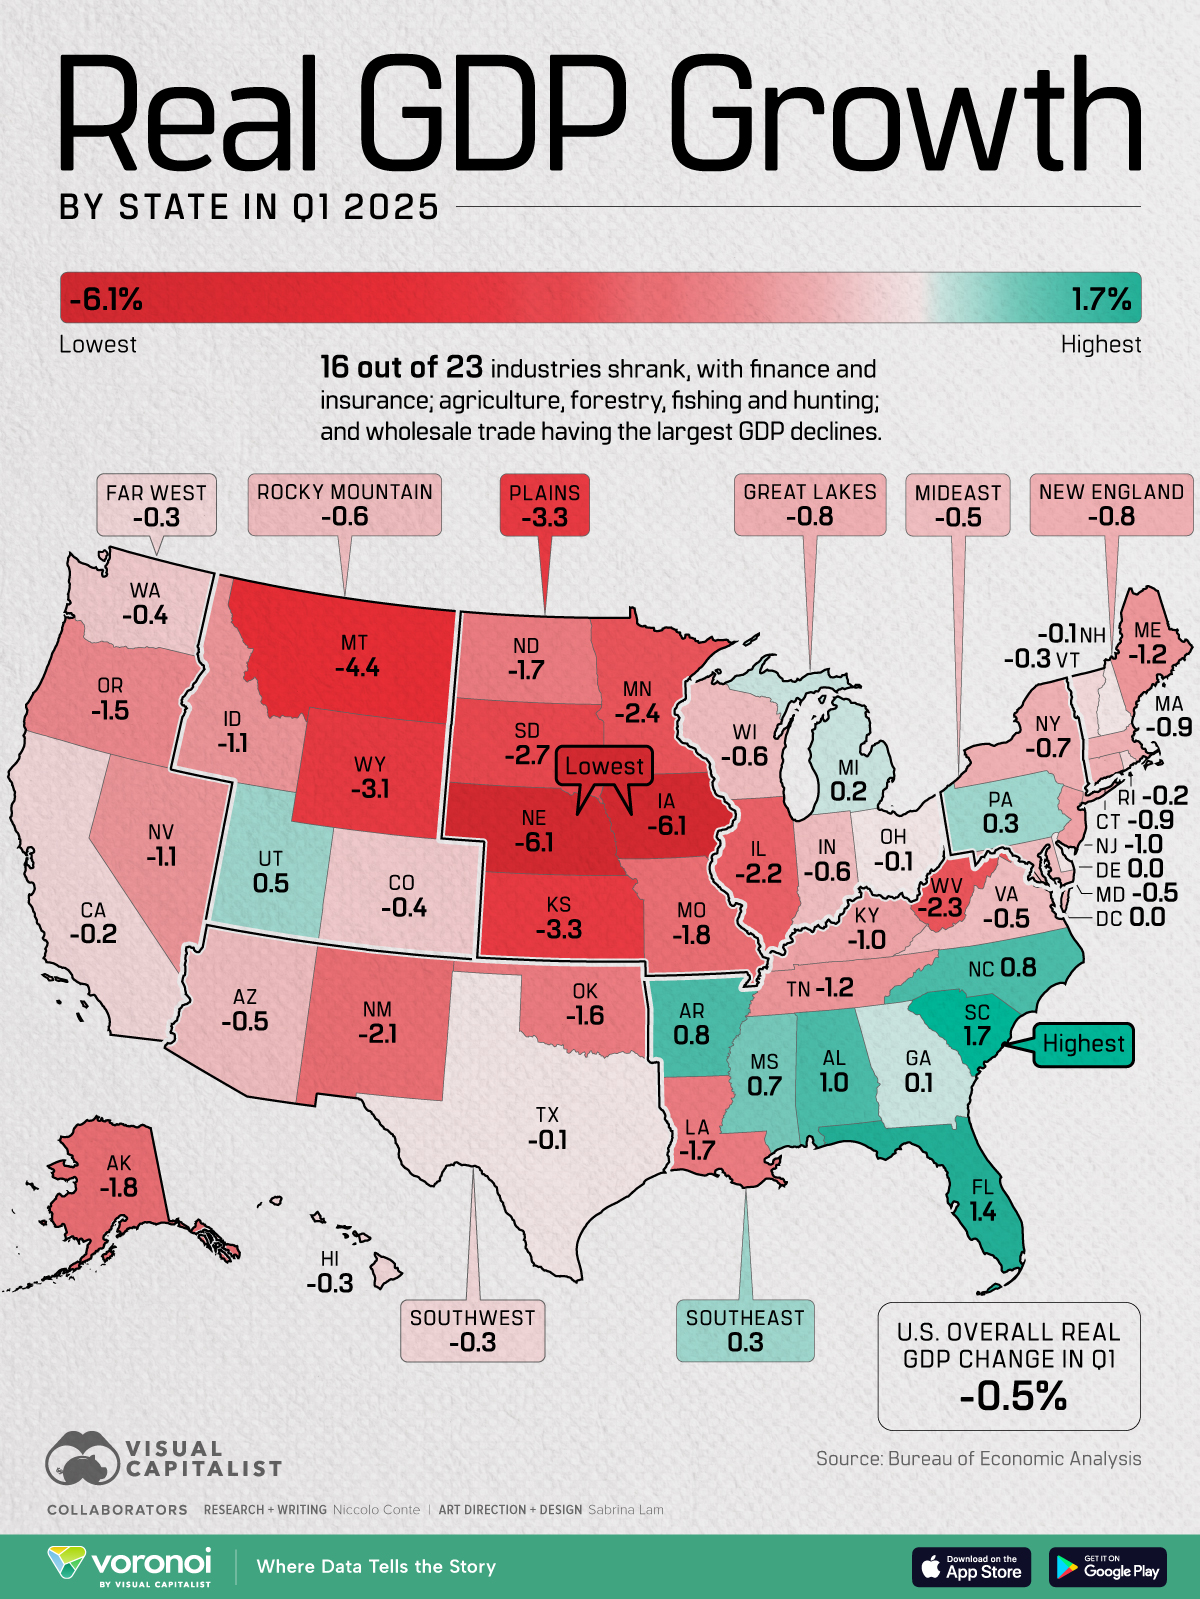
Mapped: Real GDP Growth by State in Q1 2025
This was originally posted on our Voronoi app. Download the app for free on iOS or Android and discover incredible data-driven charts from a variety of trusted sources.
Key Takeaways

Published
2 hours ago
on
August 18, 2025
| 17 views
-->
By
Jenna Ross
Graphics & Design

Key Takeaways