You are here

Canada

Visualizing Raw Material Inflation in Canada

The following content is sponsored by Canadian Manufacturers & Exporters.

Raw Material Inflation in Canada

Inflation in Canada is climbing, and it has impacted the raw materials manufacturers use to produce goods. In fact, raw material prices have climbed 37% year-over-year on average.

More than half of manufacturers say this is one of their top challenges. In this graphic from Canadian Manufacturers & Exporters (CME), we show which materials have seen the biggest price spikes over the last year.

Inflation by Raw Material

Interactive Map: Crude Oil Pipelines and Refineries of the U.S. and Canada

Mapped: Crude Oil Pipelines and Refineries of the U.S. and Canada

Pipelines are the primary method of transporting crude oil around the world, delivering oil and its derivative products swiftly to refineries and empowering reliant businesses.

And North America is a major oil hub. The U.S. and Canada alone are home to more than 90,000 miles of crude oil and petroleum product pipelines, along with more than 140 refineries that can process around 20 million barrels of oil every day.

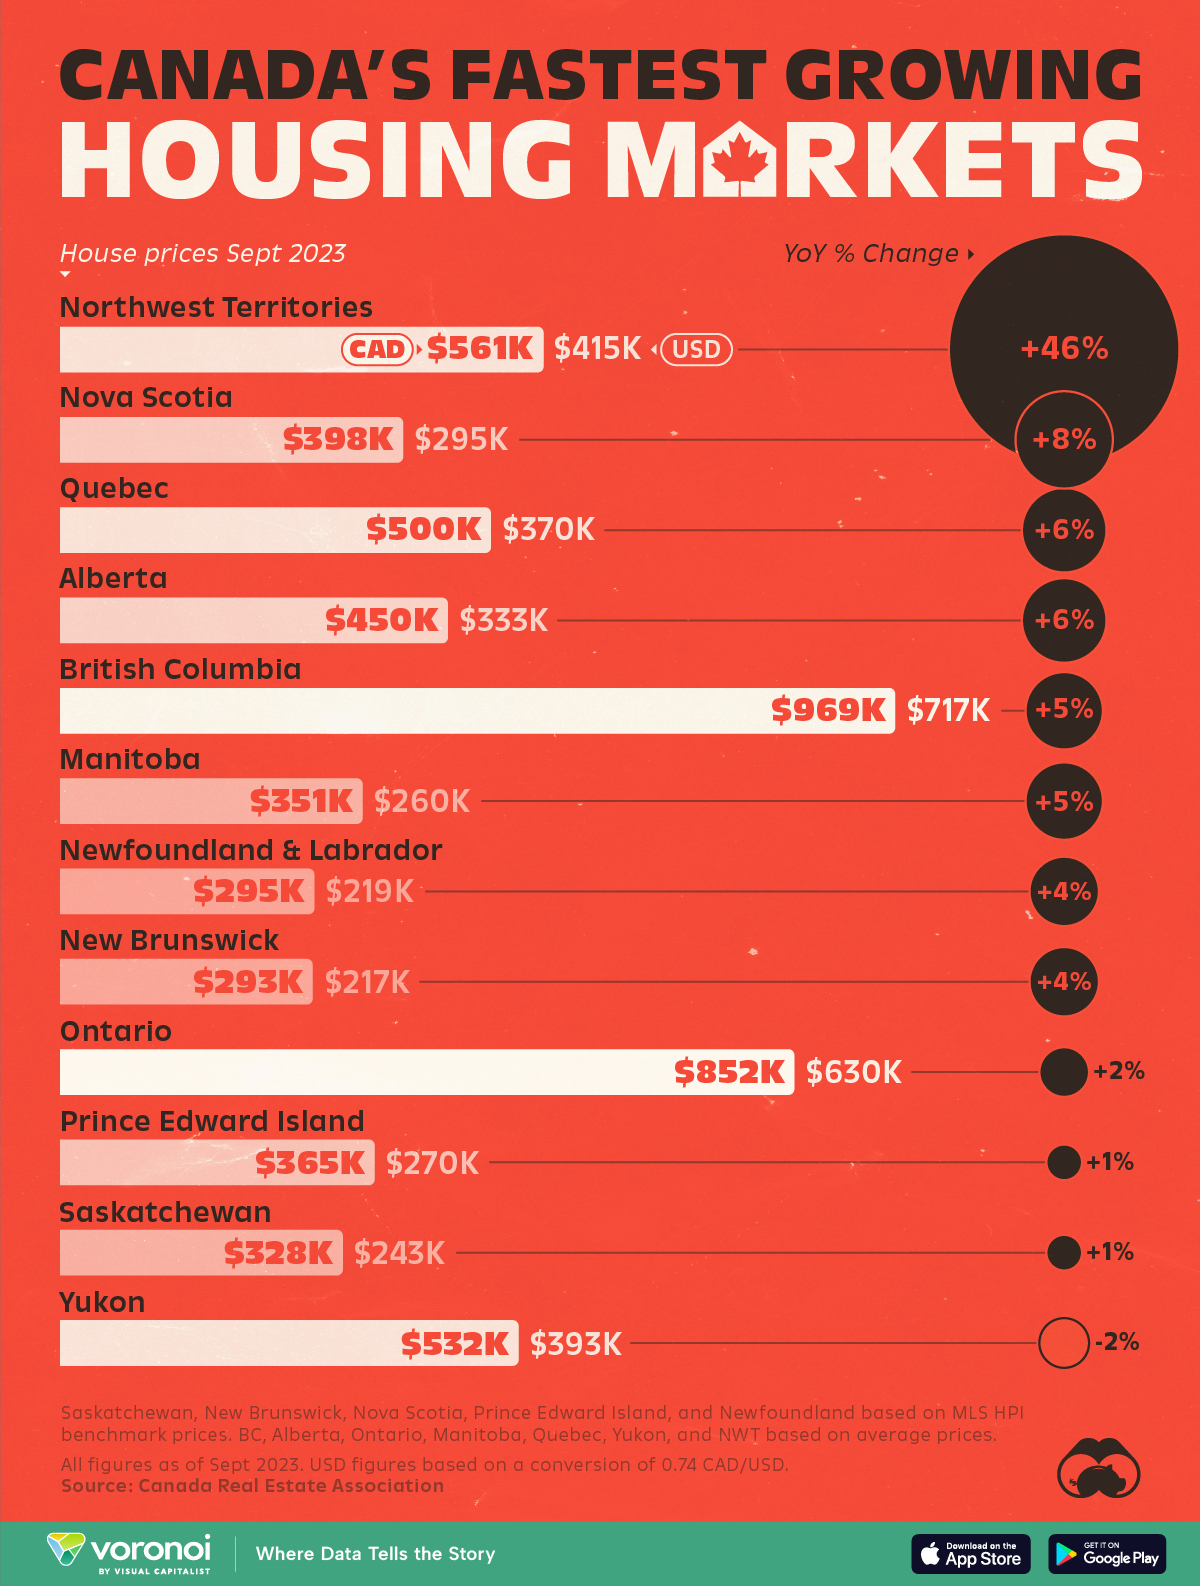
Canadian Housing Affordability Hits 27 Year Low

Canadian Housing Affordability Hits 27 Year Low

Authored by Steve Saretsky via VanCityCondoGuide.com,

Nothing says Merry Christmas like a 27 year low for Canadian housing affordability. That’s right, real estate across Canada has not been this un affordable since the year 1990 per RBC. Spoiler alert house prices tumbled shortly thereafter.

RBC Bank released their updated Q3 numbers for housing affordability. To no surprise, Vancouver leads the nation in the most unaffordable market to buy a home. Followed by Toronto and then Victoria.

Pages