You are here

S&P 500

"Fear" Indicator Surges To Record High
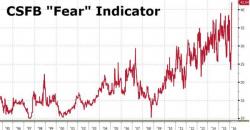
"Fear" Indicator Surges To Record High

As CS' Josh Lukeman notes, the degree of hedging we’re seeing as we go higher illustrated in the CS Fear index (now at all-time highs) suggests institutional investors are not believers in the equity rally

CSFB's "Fear" Indicator has never been higher...


For a succinct explanation of what this far less popular indicator captures we use a handy definition by SentimentTrader:


EXPLANATION:


Month-End Market Weakness Looms As Monetary Base Trumps Buybacks

Submitted by Pater Tenebrarum via Acting-Man.com,

A Useful Leading Indicator?

We often see charts comparing the S&P 500 to the growth in the Federal Reserve’s balance sheet, or more specifically, to assets held by the Fed. There is undeniably a close correlation between the two, but it has struck us as not very useful as a “timing device”, or an early warning device if you will.

What Happens To The Market Next: JPMorgan's Head Quant Explains

JPM's head quant, Marko Kolanovic, who turned somehwat gloomy in the past few months, has seen some hits and misses in his recent forecasts. On one hand he did accurately predict the surge in gold one month ago, as well as the rebound in oil and Emerging Markets; however on the other he suggested that being long VIX and cash would be a good place to wait out the upcoming market volatility.

S&P Turns Green For 2016 As "Average" Stock Reaches Key Technical Resistance

On the heels of Trannies and The Dow, The S&P 500 just crossed into green for the first time in 2016. This technical melt-up occurs as the "average" stock reaches a key intersection of recent trendlines...

S&P 2016 Green for St.Paddy's Day... 2043.94 taken out


Note the VIX tails as the market lurched higher... VIX slammed to a 13 handle...


But as Dana Lyons' notes, the "average" stock is hitting key resistance...

Pages