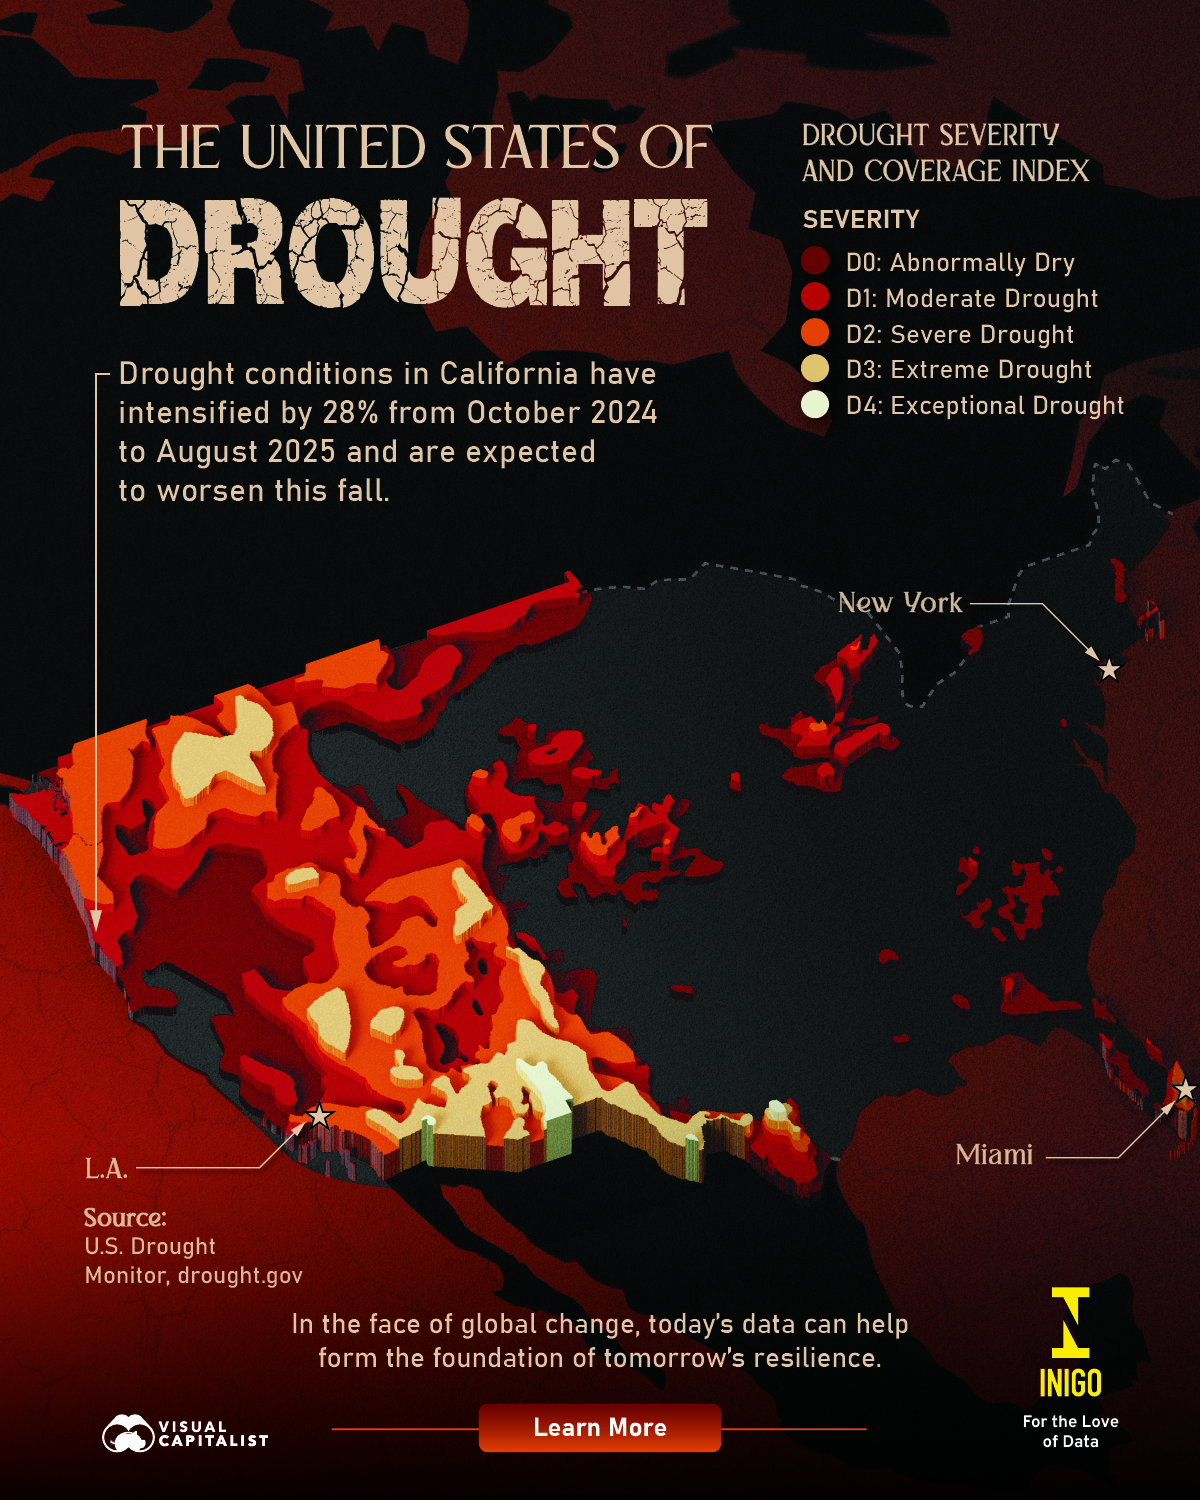
Mapped: The United States of Drought
Published
1 hour ago
on
August 23, 2025
| 13 views
-->
By
Julia Wendling
Graphics & Design
Published
1 hour ago
on
August 23, 2025
| 13 views
-->
By
Julia Wendling
Graphics & Design
![]()
See this visualization first on the Voronoi app.
Use This Visualization
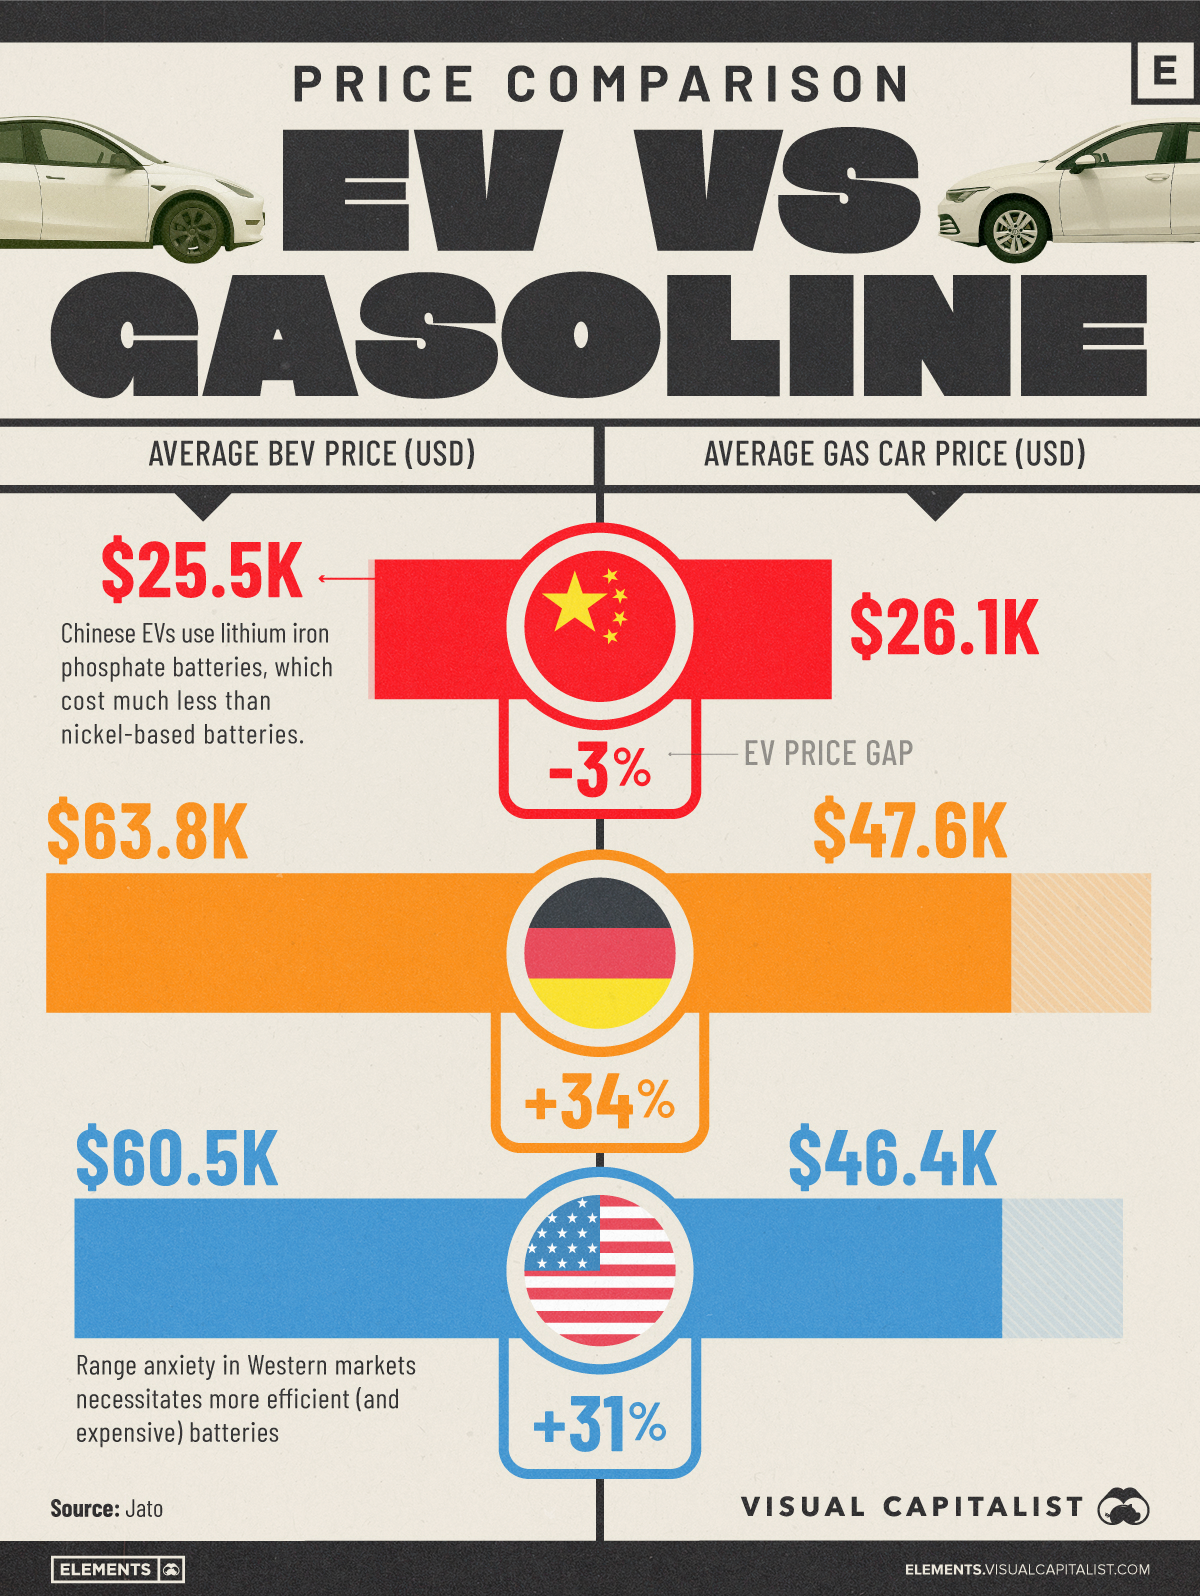
Price Comparison: EVs vs. Gasoline Cars
This was originally posted on our Voronoi app. Download the app for free on iOS or Android and discover incredible data-driven charts from a variety of trusted sources.
Key Takeaways
![]()
See this visualization first on the Voronoi app.
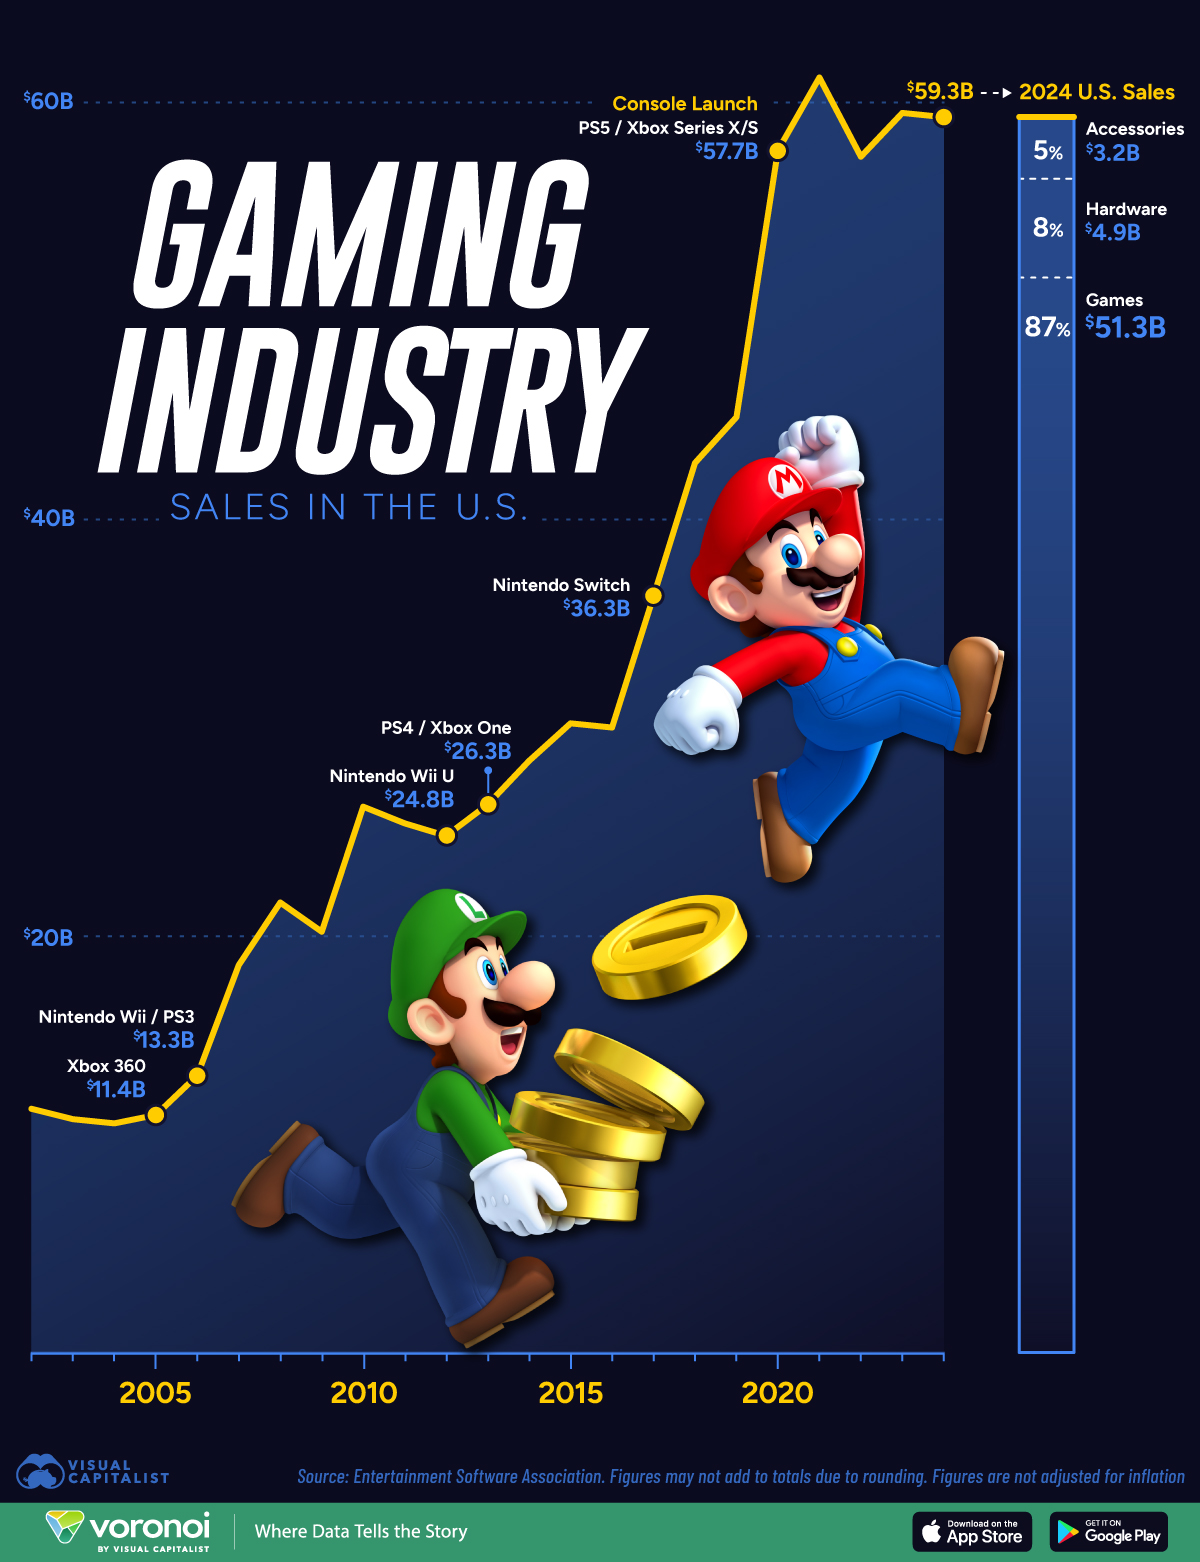
Charted: Video Game Industry Revenue in the U.S. Over Time
This was originally posted on our Voronoi app. Download the app for free on iOS or Android and discover incredible data-driven charts from a variety of trusted sources.
Key Takeaways

Published
55 mins ago
on
August 19, 2025
| 9 views
-->
By
Julia Wendling
Graphics & Design
![]()
See this visualization first on the Voronoi app.
Use This Visualization
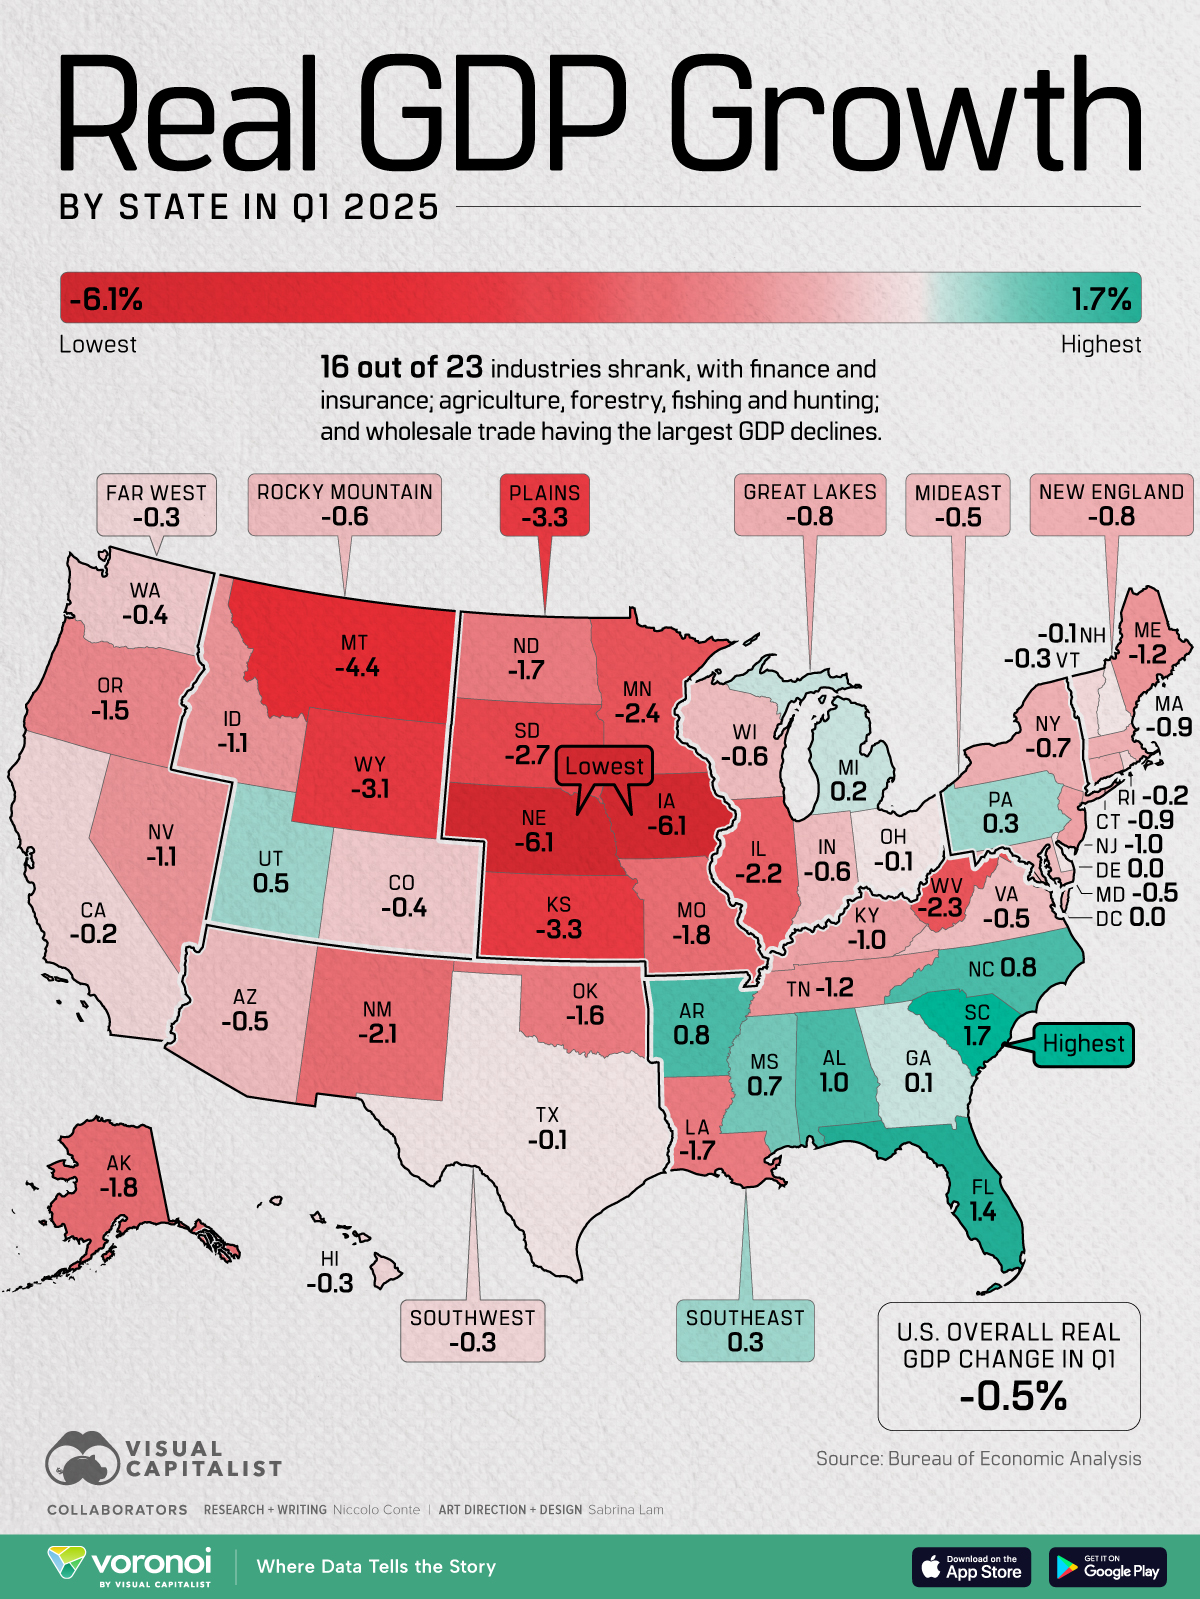
Mapped: Real GDP Growth by State in Q1 2025
This was originally posted on our Voronoi app. Download the app for free on iOS or Android and discover incredible data-driven charts from a variety of trusted sources.
Key Takeaways