The 25 Worst Stocks by Shareholder Wealth Losses (1926-2022)

The 25 Worst Stocks by Shareholder Wealth Losses (1926-2022)
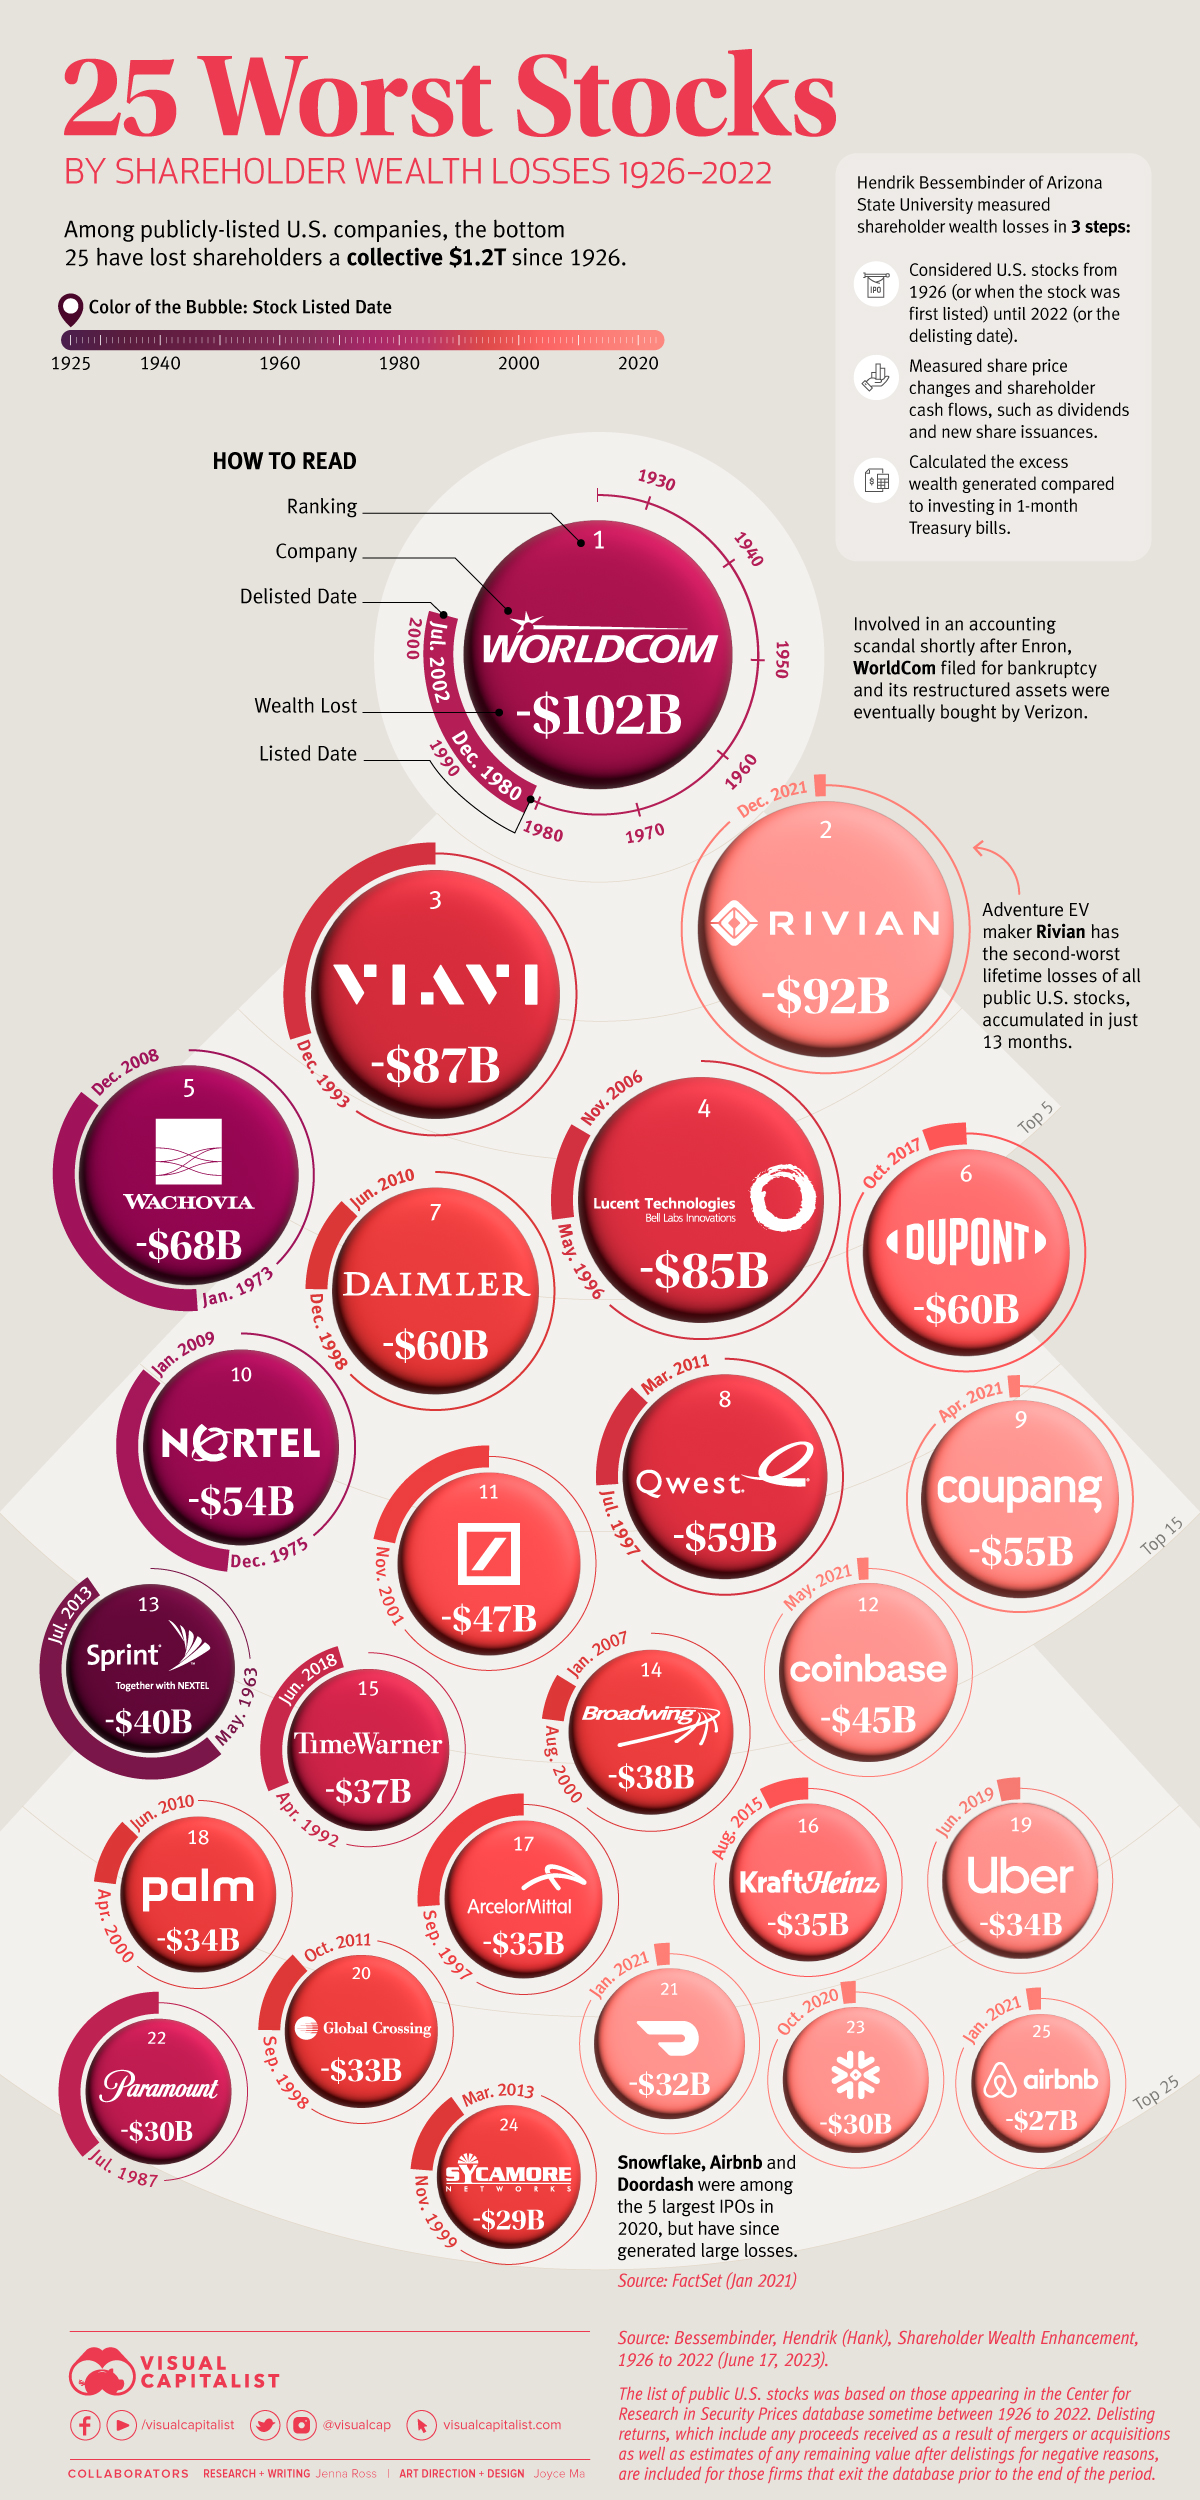
Among publicly-listed U.S. companies, the 25 worst stocks have lost shareholders a collective $1.2 trillion since 1926. Put another way, just 0.1% of all stocks have led to 14% of all cumulative losses in shareholder wealth.
In this graphic, we use data from Henrik Bessembinder of Arizona State University to show the worst stocks of the last century.

