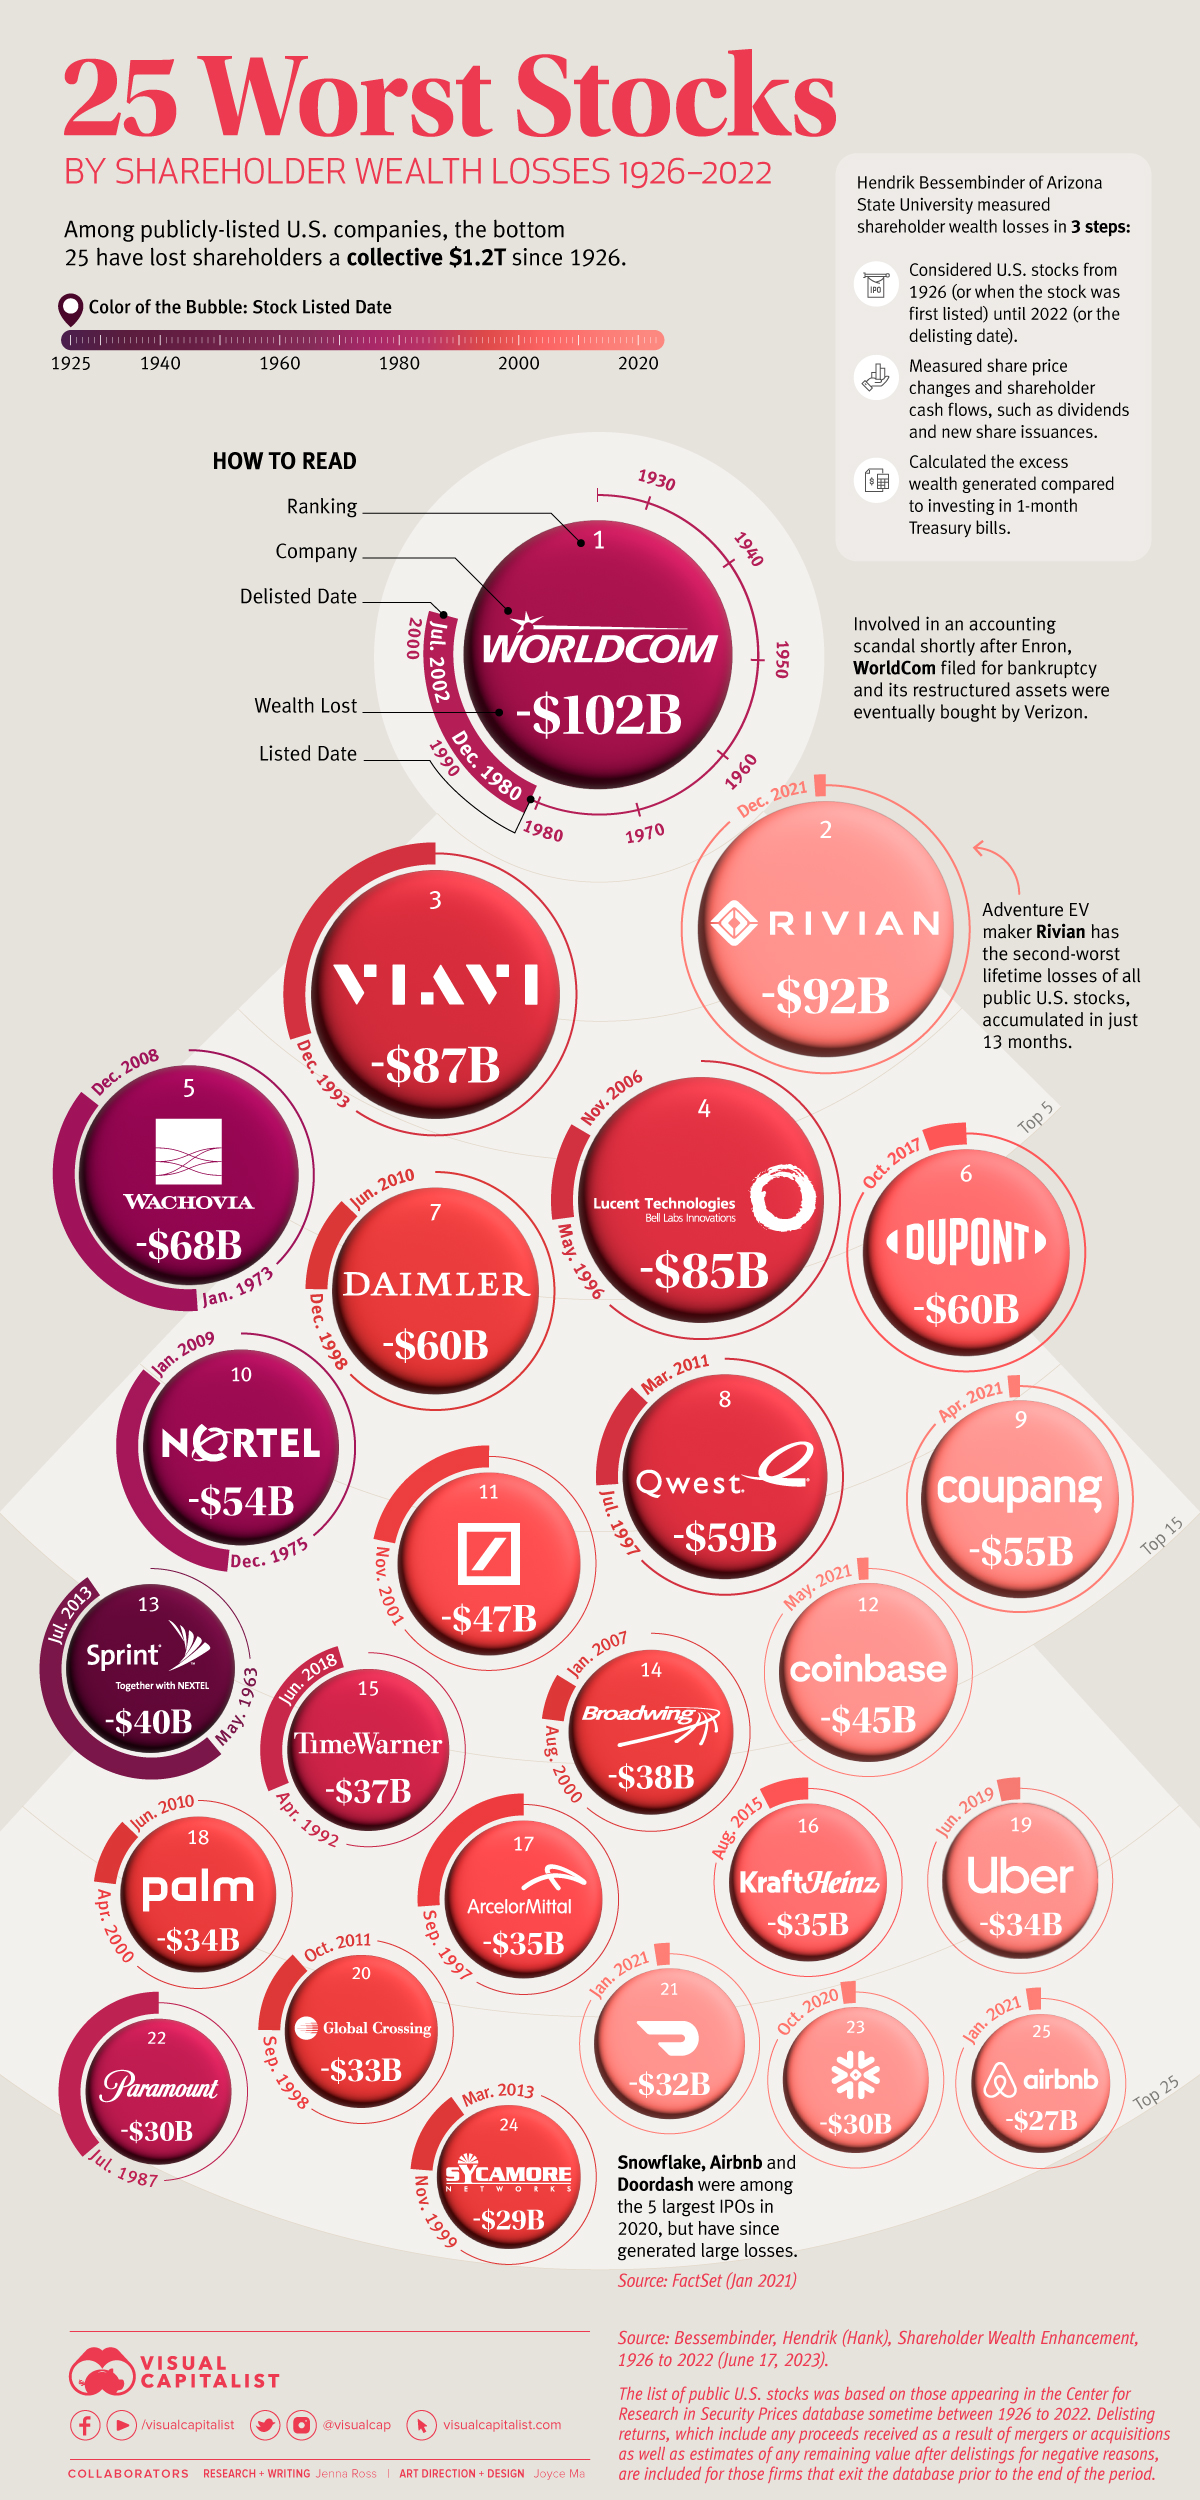
The 25 Worst Stocks by Shareholder Wealth Losses (1926-2022)
Among publicly-listed U.S. companies, the 25 worst stocks have lost shareholders a collective $1.2 trillion since 1926. Put another way, just 0.1% of all stocks have led to 14% of all cumulative losses in shareholder wealth.
In this graphic, we use data from Henrik Bessembinder of Arizona State University to show the worst stocks of the last century.
How Are Shareholder Wealth Losses Calculated?
Bessembinder took three steps to measure lifetime shareholder wealth losses:
- Considered U.S. stocks in the Center for Research in Security Prices database from 1926 (or when the stock was first listed) until 2022 (or when the stock was delisted).
- Measured share price changes as well as cash flows to/from shareholders including dividends, spinoffs, share buybacks, and new share issuances.
- Calculated the excess wealth generated compared to investing in one-month Treasury bills over the same time period.
If a company exited the database during the period, Bessembinder calculated its delisting return based on any proceeds from mergers or acquisitions as well as estimates of any remaining value after delistings for negative reasons.
The 25 Worst Stocks in Modern History
With this context in mind, here are the worst stocks since 1926.
| Rank | Company | Lifetime Wealth Losses | First Month | Last Month |
|---|---|---|---|---|
| 1 | WORLDCOM | -$102B | Dec‐80 | Jul‐02 |
| 2 | RIVIAN AUTOMOTIVE | -$92B | Dec‐21 | Dec‐22 |
| 3 | VIAVI SOLUTIONS | -$87B | Dec‐93 | Dec‐22 |
| 4 | LUCENT TECHNOLOGIES | -$85B | May‐96 | Nov‐06 |
| 5 | WACHOVIA | -$68B | Jan‐73 | Dec‐08 |
| 6 | DUPONT DE NEMOURS | -$60B | Oct‐17 | Dec‐22 |
| 7 | DAIMLER | -$60B | Dec‐98 | Jun‐10 |
| 8 | QWEST COMMUNICATIONS INTL | -$59B | Jul‐97 | Mar‐11 |
| 9 | COUPANG | -$55B | Apr‐21 | Dec‐22 |
| 10 | NORTEL NETWORKS | -$54B | Dec‐75 | Jan‐09 |
| 11 | DEUTSCHE BANK | -$47B | Nov‐01 | Dec‐22 |
| 12 | COINBASE | -$45B | May‐21 | Dec‐22 |
| 13 | SPRINT NEXTEL | -$40B | May‐63 | Jul‐13 |
| 14 | BROADWING | -$38B | Aug‐00 | Jan‐07 |
| 15 | TIME WARNER | -$37B | Apr‐92 | Jun‐18 |
| 16 | KRAFT HEINZ | -$35B | Aug‐15 | Dec‐22 |
| 17 | ARCELORMITTAL SA LUXEMBOURG | -$35B | Sep‐97 | Dec‐22 |
| 18 | PALM | -$34B | Apr‐00 | Jun‐10 |
| 19 | UBER | -$34B | Jun‐19 | Dec‐22 |
| 20 | GLOBAL CROSSING | -$33B | Sep‐98 | Oct‐11 |
| 21 | DOORDASH | -$32B | Jan‐21 | Dec‐22 |
| 22 | PARAMOUNT | -$30B | Jul‐87 | Dec‐22 |
| 23 | SNOWFLAKE | -$30B | Oct‐20 | Dec‐22 |
| 24 | SYCAMORE NETWORKS | -$29B | Nov‐99 | Mar‐13 |
| 25 | AIRBNB | -$27B | Jan‐21 | Dec‐22 |
WorldCom, number one on the list, was a long-distance phone provider and handled internet data. In response to a surplus of telecommunications capacity that reduced pricing power, WorldCom began “cooking its books” to meet growth targets.
An SEC investigation of the accounting scandal found that executives improperly reduced costs by more than $7 billion and exaggerated revenue by at least $958 million. Once the fraud was discovered, WorldCom filed for the largest bankruptcy filing in American history as of July 2002.
Some of the worst stocks by lifetime wealth losses have gone public within the last few years. For instance, Doordash was one of the largest IPOs in 2020, with investor enthusiasm driving its share price 86% higher in the first day. The company has seen its revenue and U.S. market share increase, but it has yet to produce a 12-month profit.
Common Threads
Among the worst-performing stocks, there are some patterns. For instance, eight of the 25 stocks on this list belong to the telecommunications industry. Like WorldCom, many of these companies also engaged in accounting fraud to inflate their financial results.
Financial fraud can be hard to detect, but investors can look for potential red flags such as consistent sales growth while competitors are struggling. The SEC noted in its WorldCom investigation that “WorldCom claimed it was successfully managing industry trends that were hurting all of its competitors”.
Another commonality among some of the worst stocks was the hype around their IPOs. High valuations that are not supported by profitability may lead to large shareholder losses.
The post The 25 Worst Stocks by Shareholder Wealth Losses (1926-2022) appeared first on Visual Capitalist.