Published
31 mins ago
on
September 10, 2023
| 4 views
-->
By
Bruno Venditti
The following content is sponsored by BCRMA
Visualizing Mining’s Footprint in British Columbia
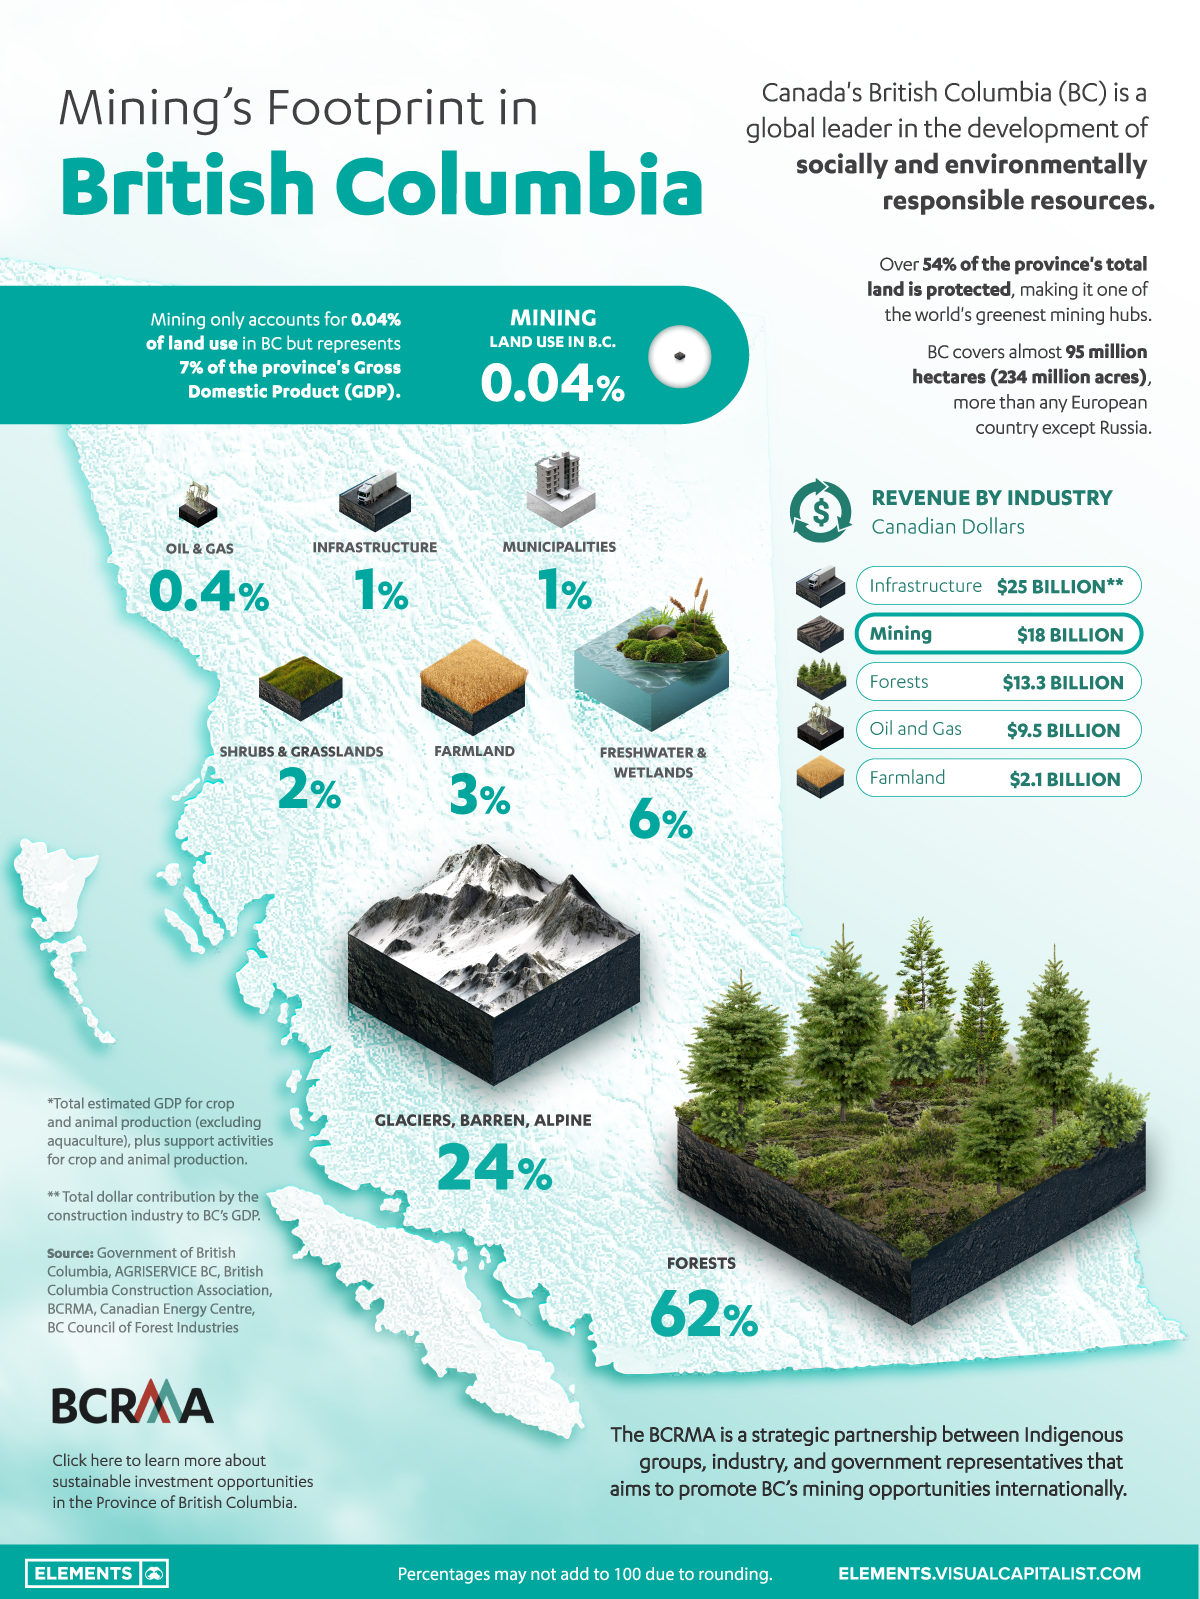
British Columbia is considered a global leader in the development of socially and environmentally responsible resources.
An estimated 54% of the province’s total land is protected, making it one of the world’s greenest mining hubs.
This graphic by the B.C. Regional Mining Alliance (BCRMA) details mining’s footprint in the province.
A Tier 1 Jurisdiction for Mining
British Columbia covers almost 95 million hectares (234 million acres), more than any European country except Russia, and more than any U.S. state except Alaska.
As the largest mining province in Canada, BC registered $18 billion in revenue from the industry in 2022.
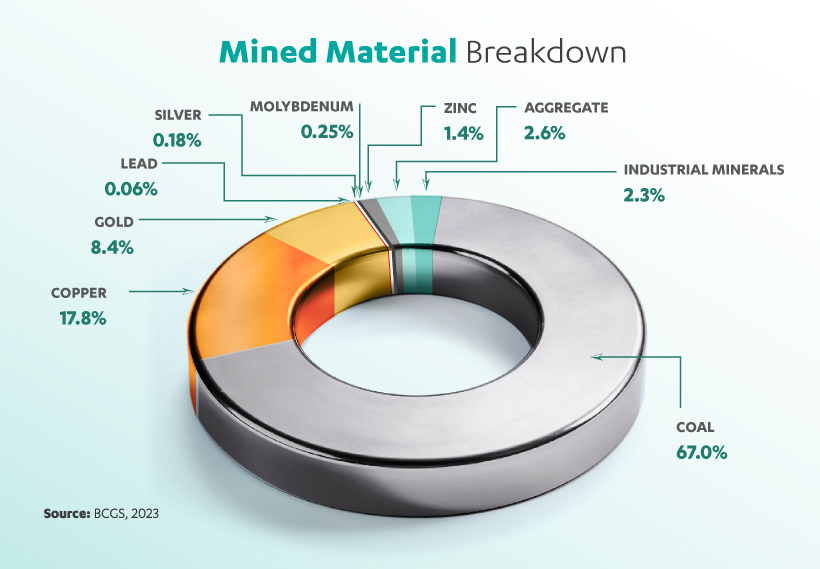
British Columbia stands as Canada’s sole producer of molybdenum, which finds applications in metallurgy and chemistry. Additionally, B.C. is the country’s leader producer of copper and steelmaking coal, besides gold and silver.
At the heart of British Columbia’s mining industry lies the Golden Triangle, one of the hottest mineral exploration districts in the world.
More than 150 mines have operated in the area since prospectors first arrived at the end of the 19th century. The region alone is endowed with minerals worth more than $800 billion.
How Green is B.C. Mining
Mining represents 7% of the province’s Gross Domestic Product (GDP), despite only accounting for 0.04% of the land use. In comparison, farmland demands 3% of the land, bringing $2.1 billion (0.8%) per year.
| Land Use in B.C. | Revenue (2022, CAD $) | |
|---|---|---|
| Mining | 0.04% | $18.0 billion |
| Oil & Gas | 0.4% | $9.5 billion |
| Infrastructure | 1% | $25.0 billion |
| Farmland | 3% | $2.1 billion |
| Forest | 62% | $13.3 billion |
Mining operations are also supported by a stable, transparent, and effective policy environment. The province ranked as the world’s least risky for mining in 2017 and 2018.
In addition, mineral exploration has received ample support from local Indigenous communities. Today, mining accounts for over two-thirds of all indigenous people employed in the extractives sector.
According to the International Energy Agency, up to six times more minerals and metals will be needed by 2040 to accelerate the energy transition.
In this scenario, British Columbia is well positioned to support the transition to a low-carbon future and make a significant contribution to climate action.
The BCRMA is a strategic partnership between indigenous groups, industry, and government representatives that aims to promote B.C.’s mining opportunities internationally.

Please enable JavaScript in your browser to complete this form.Enjoying the data visualization above? *Subscribe
Related Topics: #gold #british columbia #coal #golden triangle #BCRMA #B.C. #B.C. Regional Mining Alliance #mining #canada #copper
Click for Comments
var disqus_shortname = "visualcapitalist.disqus.com";
var disqus_title = "Visualizing Mining’s Footprint in British Columbia";
var disqus_url = "https://www.visualcapitalist.com/sp/visualizing-minings-footprint-in-british-columbia/";
var disqus_identifier = "visualcapitalist.disqus.com-160936";
You may also like
-

Strategic Metals1 month ago
Charted: America’s Import Reliance of Key Minerals
The U.S. is heavily reliant on imports for many critical minerals. How import-dependent is the U.S. for each one, and on which country?
-
Batteries2 months ago
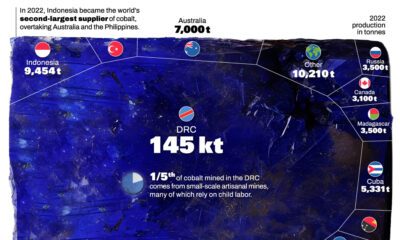
Ranked: The World’s Top Cobalt Producing Countries
Cobalt, an essential component for certain types of EV batteries, has seen a significant shift in its global production landscape.
-

Energy2 months ago
How Big is the Market for Crude Oil?
The oil market is bigger than the 10 largest metal markets combined, with production value exceeding $2 trillion annually.
-
Mining4 months ago
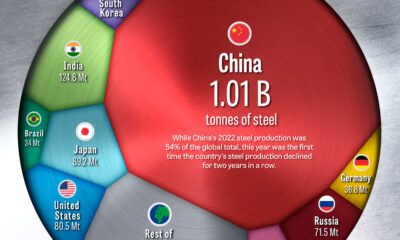
Ranked: The World’s Biggest Steel Producers, by Country
China has dominated global steel production the past few decades, but how did the country get here, and is its production growth over?
-

Money6 months ago
Charted: 30 Years of Central Bank Gold Demand
Globally, central banks bought a record 1,136 tonnes of gold in 2022. How has central bank gold demand changed over the last three decades?
-

Energy8 months ago
Visualizing U.S. Consumption of Fuel and Materials per Capita
Wealthy countries consume large amounts of natural resources per capita, and the U.S. is no exception. See how much is used per person.
Subscribe
Please enable JavaScript in your browser to complete this form.Join the 375,000+ subscribers who receive our daily email *Sign Up
The post Visualizing Mining’s Footprint in British Columbia appeared first on Visual Capitalist.