![]()
See this visualization first on the Voronoi app.
Use This Visualization
Charted: The Average U.S. Tariff Rate Since 1890
This was originally posted on our Voronoi app. Download the app for free on iOS or Android and discover incredible data-driven charts from a variety of trusted sources.
Key Takeaways
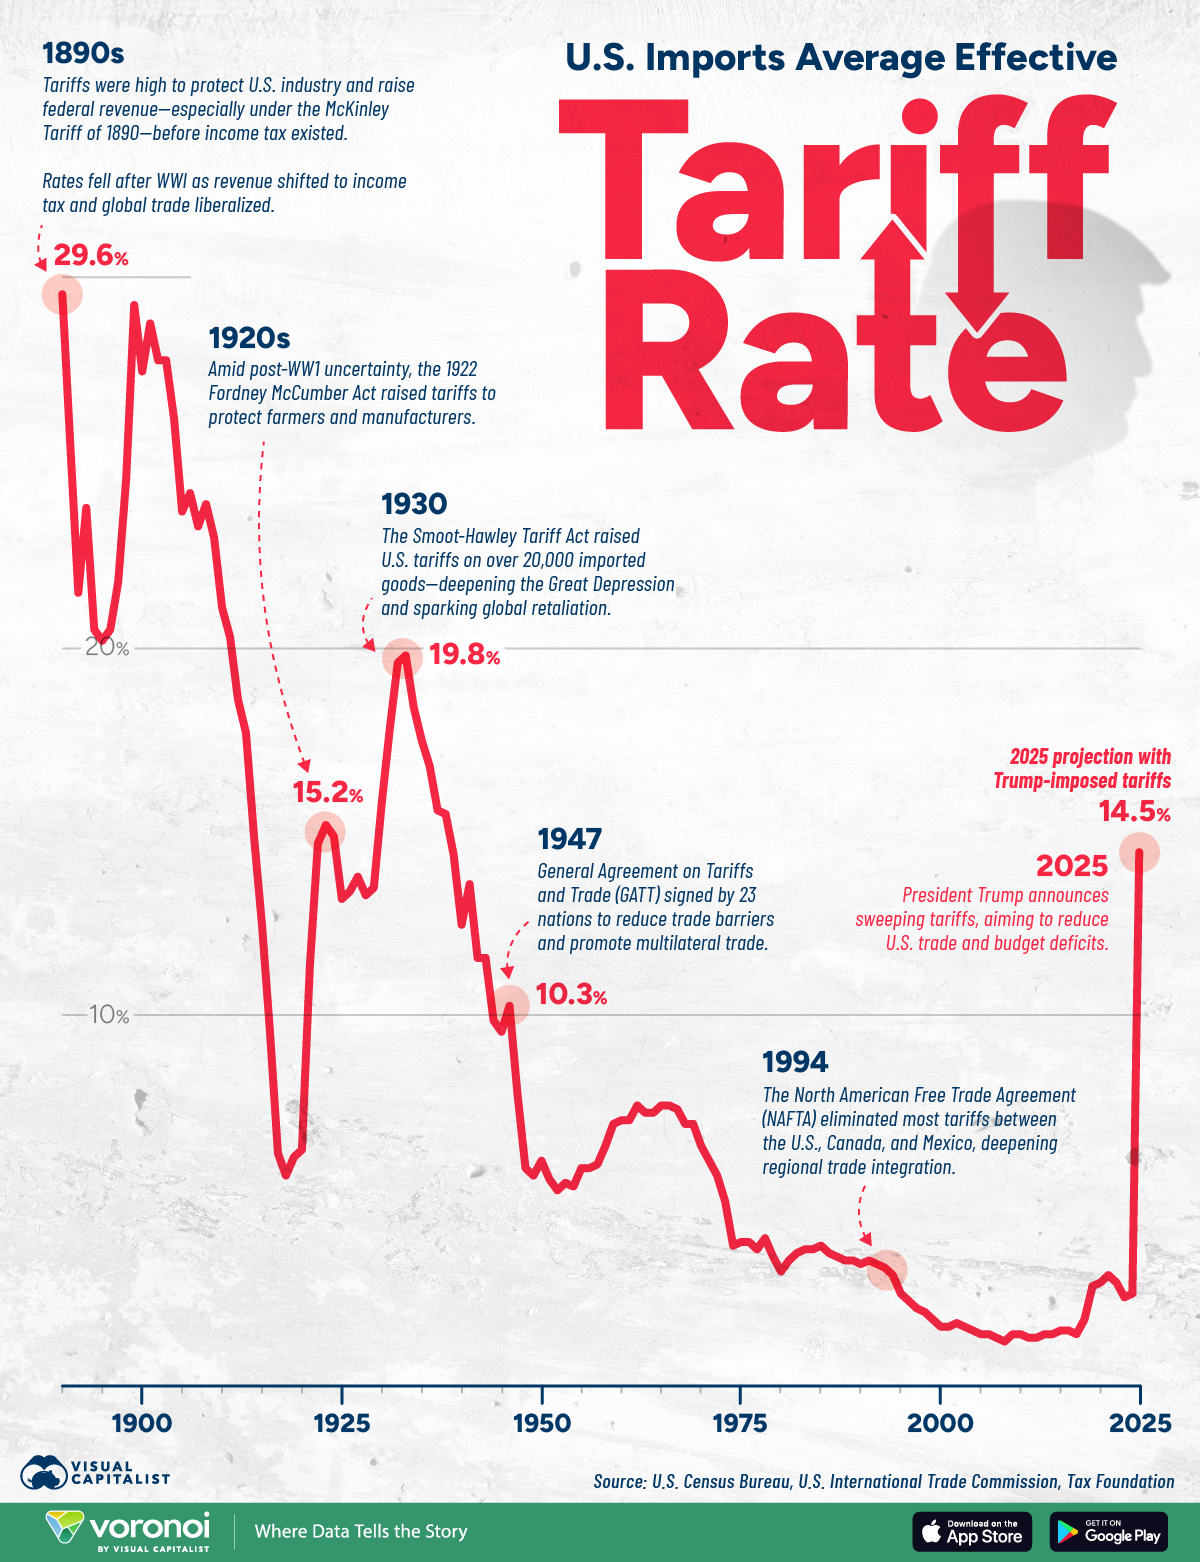
- The U.S. average effective tariff rate on imports spiked to 14.5%—its highest level since 1938.
- In 2024, the average rate was 2.5%.
- The situation is developing. However, as of April 9th, the newly imposed tariffs were projected to generate $206.6 billion in federal revenue and slash imports by 30% in 2025.
On almost a weekly—if not daily basis—American trade policy changes.
While Trump imposed heavy reciprocal tariffs on about 100 nations last week, he announced a 90-day pause on countries that didn’t retaliate on April 9th. Overall, the 10% blanket tariff on U.S. imports remains in place.
This graphic shows the U.S. import average tariff rate over history, based on data from the Tax Foundation.
A Brief History of U.S. Tariffs
In 2025, the average U.S. tariff on imports has surged to 14.5%—the highest level in nearly 90 years.
As trade tensions escalate, tariffs on China jumped to 125% and China’s levies on America now stand at 84%. In response, market volatility is spiking given the unpredictable nature of Trump’s trade policy.
Below, we show how U.S. tariff rates have evolved since 1890:
| Year | Average rate on all imports (%) |
|---|---|
| 2025 | 14.5 |
| 2024 | 2.5 |
| 2023 | 2.4 |
| 2022 | 2.8 |
| 2021 | 3.0 |
| 2020 | 2.8 |
| 2019 | 2.7 |
| 2018 | 1.8 |
| 2017 | 1.4 |
| 2016 | 1.5 |
| 2015 | 1.5 |
| 2014 | 1.4 |
| 2013 | 1.4 |
| 2012 | 1.3 |
| 2011 | 1.3 |
| 2010 | 1.4 |
| 2009 | 1.4 |
| 2008 | 1.2 |
| 2007 | 1.3 |
| 2006 | 1.4 |
| 2005 | 1.4 |
| 2004 | 1.5 |
| 2003 | 1.6 |
| 2002 | 1.7 |
| 2001 | 1.6 |
| 2000 | 1.6 |
| 1999 | 1.8 |
| 1998 | 2.0 |
| 1997 | 2.1 |
| 1996 | 2.3 |
| 1995 | 2.5 |
| 1994 | 3.0 |
| 1993 | 3.2 |
| 1992 | 3.3 |
| 1991 | 3.4 |
| 1990 | 3.3 |
| 1989 | 3.4 |
| 1988 | 3.4 |
| 1987 | 3.5 |
| 1986 | 3.6 |
| 1985 | 3.8 |
| 1984 | 3.7 |
| 1983 | 3.7 |
| 1982 | 3.6 |
| 1981 | 3.4 |
| 1980 | 3.1 |
| 1979 | 3.5 |
| 1978 | 4.0 |
| 1977 | 3.7 |
| 1976 | 3.9 |
| 1975 | 3.9 |
| 1974 | 3.8 |
| 1973 | 5.0 |
| 1972 | 5.7 |
| 1971 | 6.1 |
| 1970 | 6.5 |
| 1969 | 7.1 |
| 1968 | 7.1 |
| 1967 | 7.5 |
| 1966 | 7.6 |
| 1965 | 7.6 |
| 1964 | 7.4 |
| 1963 | 7.4 |
| 1962 | 7.6 |
| 1961 | 7.2 |
| 1960 | 7.2 |
| 1959 | 7.1 |
| 1958 | 6.5 |
| 1957 | 6.0 |
| 1956 | 5.9 |
| 1955 | 5.9 |
| 1954 | 5.4 |
| 1953 | 5.5 |
| 1952 | 5.3 |
| 1951 | 5.6 |
| 1950 | 6.1 |
| 1949 | 5.7 |
| 1948 | 5.9 |
| 1947 | 7.9 |
| 1946 | 10.3 |
| 1945 | 9.6 |
| 1944 | 9.9 |
| 1943 | 11.6 |
| 1942 | 11.6 |
| 1941 | 13.6 |
| 1940 | 12.5 |
| 1939 | 14.4 |
| 1938 | 15.5 |
| 1937 | 15.6 |
| 1936 | 16.8 |
| 1935 | 17.5 |
| 1934 | 18.4 |
| 1933 | 19.8 |
| 1932 | 19.6 |
| 1931 | 17.8 |
| 1930 | 15.8 |
| 1929 | 13.5 |
| 1928 | 13.3 |
| 1927 | 13.8 |
| 1926 | 13.4 |
| 1925 | 13.2 |
| 1924 | 14.9 |
| 1923 | 15.2 |
| 1922 | 14.7 |
| 1921 | 11.4 |
| 1920 | 6.4 |
| 1919 | 6.2 |
| 1918 | 5.7 |
| 1917 | 6.3 |
| 1916 | 9.6 |
| 1915 | 12.5 |
| 1914 | 14.9 |
| 1913 | 17.7 |
| 1912 | 18.6 |
| 1911 | 20.3 |
| 1910 | 21.1 |
| 1909 | 23.0 |
| 1908 | 23.9 |
| 1907 | 23.3 |
| 1906 | 24.2 |
| 1905 | 23.7 |
| 1904 | 26.2 |
| 1903 | 27.8 |
| 1902 | 27.8 |
| 1901 | 28.8 |
| 1900 | 27.5 |
| 1899 | 29.3 |
| 1898 | 24.6 |
| 1897 | 21.8 |
| 1896 | 20.5 |
| 1895 | 20.2 |
| 1894 | 20.5 |
| 1893 | 23.8 |
| 1892 | 21.5 |
| 1891 | 25.5 |
| 1890 | 29.6 |
In the late 19th century, tariff rates climbed as high as 29.6% under the McKinley Tariff of 1890.
At the time, tariffs were used to protect U.S. industry and generate government revenue as income tax did not exist. As global trade liberalized after WWI, tariffs fell and the government introduced higher income taxes.
However, tariffs rose again in response to economic instability. In 1922, the Fordney-McCumber Act increased average tariffs to 15.2% to shield American manufacturers and farmers. During the Great Depression, the Smoot-Hawley Tariff Act of 1930 pushed rates even higher—to 19.8%—in an effort to protect domestic jobs and industries.
In the following decades, tariffs declined amid multilateral trade agreements that aimed to remove trade barriers. Among the most notable are the 1947 General Agreement on Tariffs and Trade and the 1994 North American Free Trade Agreement, which virtually eliminated tariffs between America, Canada, and Mexico.
By 2024, the average U.S. tariff rate stood at 2.5%, marginally lower than the European Union, China, and several major economies worldwide.
Learn More on the Voronoi App ![]()
To learn more about this topic from a global perspective, check out this graphic on the average tariff rates of major countries.
The post Chart: The Average U.S. Tariff Rate (1890-2025) appeared first on Visual Capitalist.