![]()
See this visualization first on the Voronoi app.
Use This Visualization
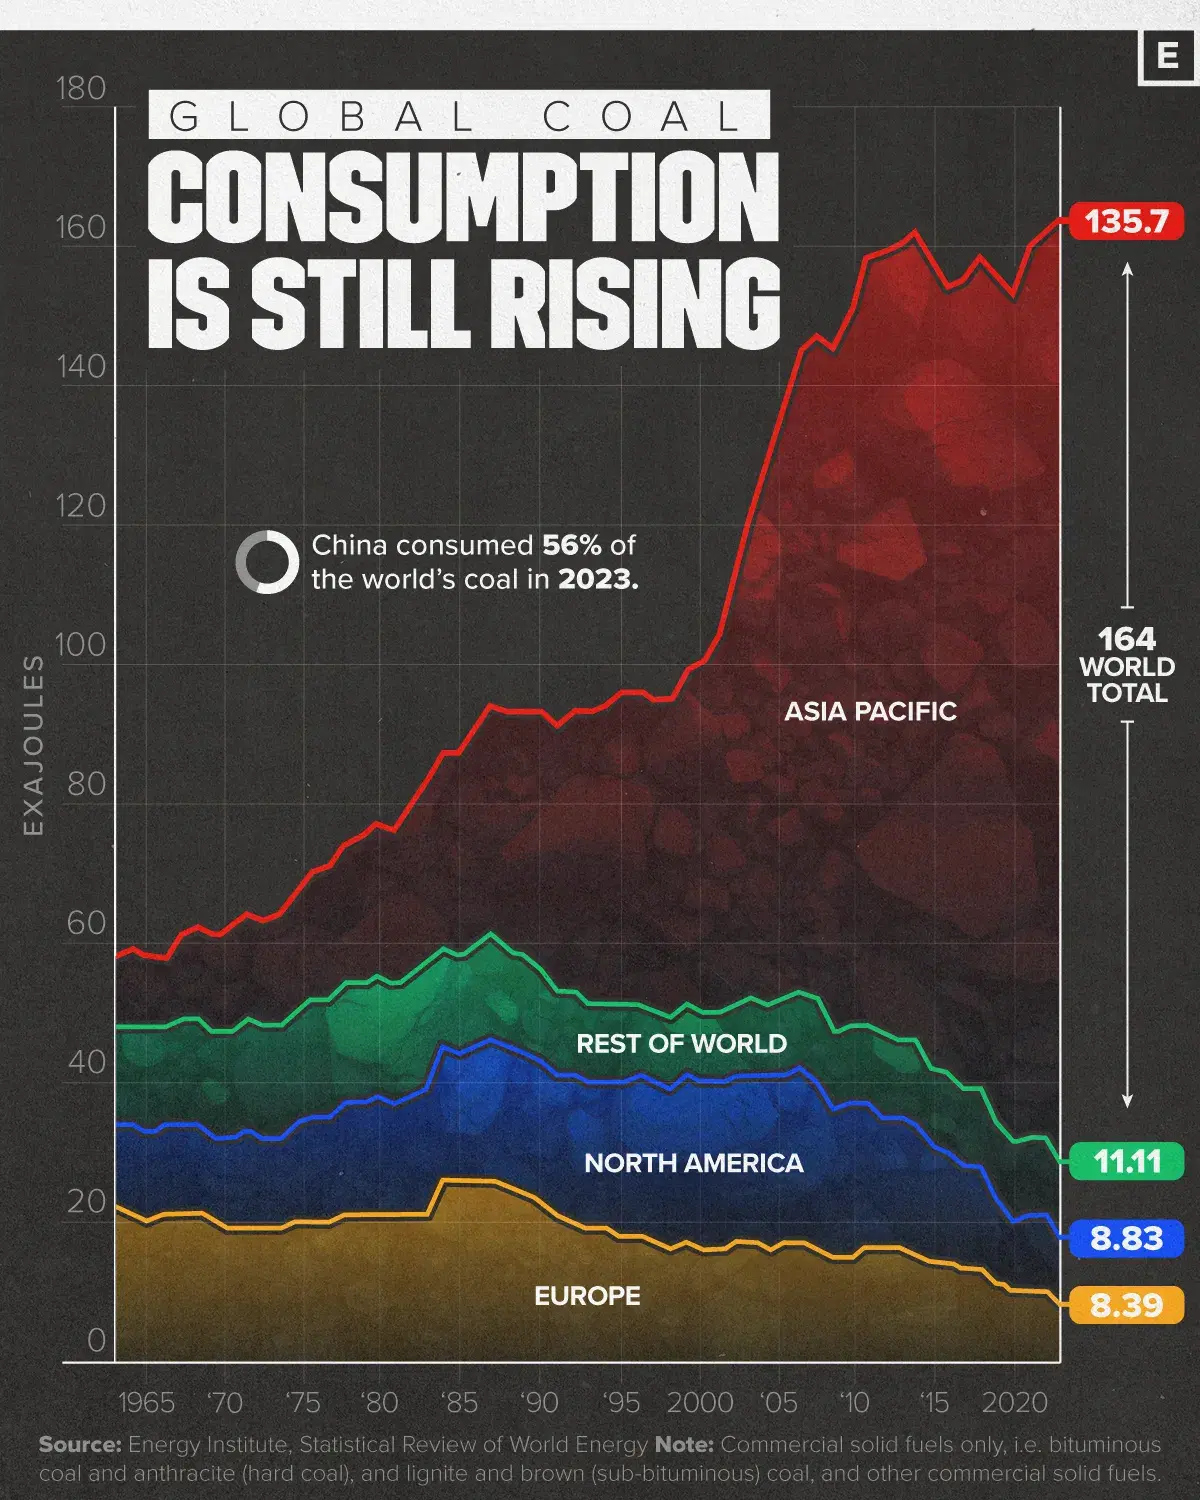
Visualizing the Rise in Global Coal Consumption (1965-2023)
This was originally posted on our Voronoi app. Download the app for free on iOS or Android and discover incredible data-driven charts from a variety of trusted sources.
Despite efforts to decarbonize the economy, global coal consumption surpassed 164 exajoules for the first time in 2023. The fossil fuel still accounts for 26% of the world’s total energy consumption.
In this graphic, we show global coal consumption by region from 1965 to 2023, based on data from the Energy Institute.
China Leads in Coal Consumption
China is by far the largest consumer of coal, accounting for 56% of the global total, with 91.94 exajoules in 2023.
It is followed by India, with 21.98 exajoules, and the U.S., with 8.20 exajoules. In 2023, India exceeded the combined consumption of Europe and North America for the first time.
Regionally, North America, Europe, and even the Rest of World have seen a decline in coal consumption since the 1990s. The Asia-Pacific region, however, has made up for this demand and more, with consumption soaring since about the year 2000.
| Year | Asia Pacific (Exajoules) | North America | Europe | Rest of the World | Total World |
|---|---|---|---|---|---|
| 2013 | 114.14 | 19.48 | 15.86 | 11.47 | 160.95 |
| 2014 | 115.74 | 19.39 | 14.88 | 11.68 | 161.62 |
| 2015 | 115.00 | 16.89 | 14.24 | 11.11 | 157.25 |
| 2016 | 113.21 | 15.55 | 13.74 | 11.35 | 153.85 |
| 2017 | 115.67 | 15.30 | 13.29 | 11.23 | 155.50 |
| 2018 | 119.05 | 14.50 | 12.98 | 11.34 | 157.87 |
| 2019 | 121.94 | 12.49 | 11.06 | 11.45 | 156.95 |
| 2020 | 121.91 | 9.97 | 9.57 | 10.82 | 152.27 |
| 2021 | 127.75 | 11.24 | 10.44 | 11.12 | 160.56 |
| 2022 | 129.80 | 10.54 | 10.02 | 11.18 | 161.53 |
| 2023 | 135.70 | 8.83 | 8.39 | 11.11 | 164.03 |
Coal Production on the Rise
In order to meet consumption demand, global coal production also reached its highest-ever level in 2023.
Over 8.7 billion tonnes of coal were mined, equal to about 179 exajoules worth, with the Asia-Pacific region accounting for nearly 80% of global output. This activity was concentrated in Australia, China, India, and Indonesia.
China alone was responsible for just over half of total global production.
Learn More on the Voronoi App ![]()
If you want to learn more about fossil fuel consumption, check out this graphic showing the top 12 countries by fossil fuel consumption in 2023.
The post Chart: Coal Consumption by Region (1965-2023) appeared first on Visual Capitalist.