![]()
See this visualization first on the Voronoi app.
Use This Visualization
American Stock Ownership Back at All-Time Highs
This was originally posted on our Voronoi app. Download the app for free on iOS or Android and discover incredible data-driven charts from a variety of trusted sources.
Today, the proprtion of Americans’ financial assets invested in public stocks is nearing record highs, just shy of the peak seen in 2021.
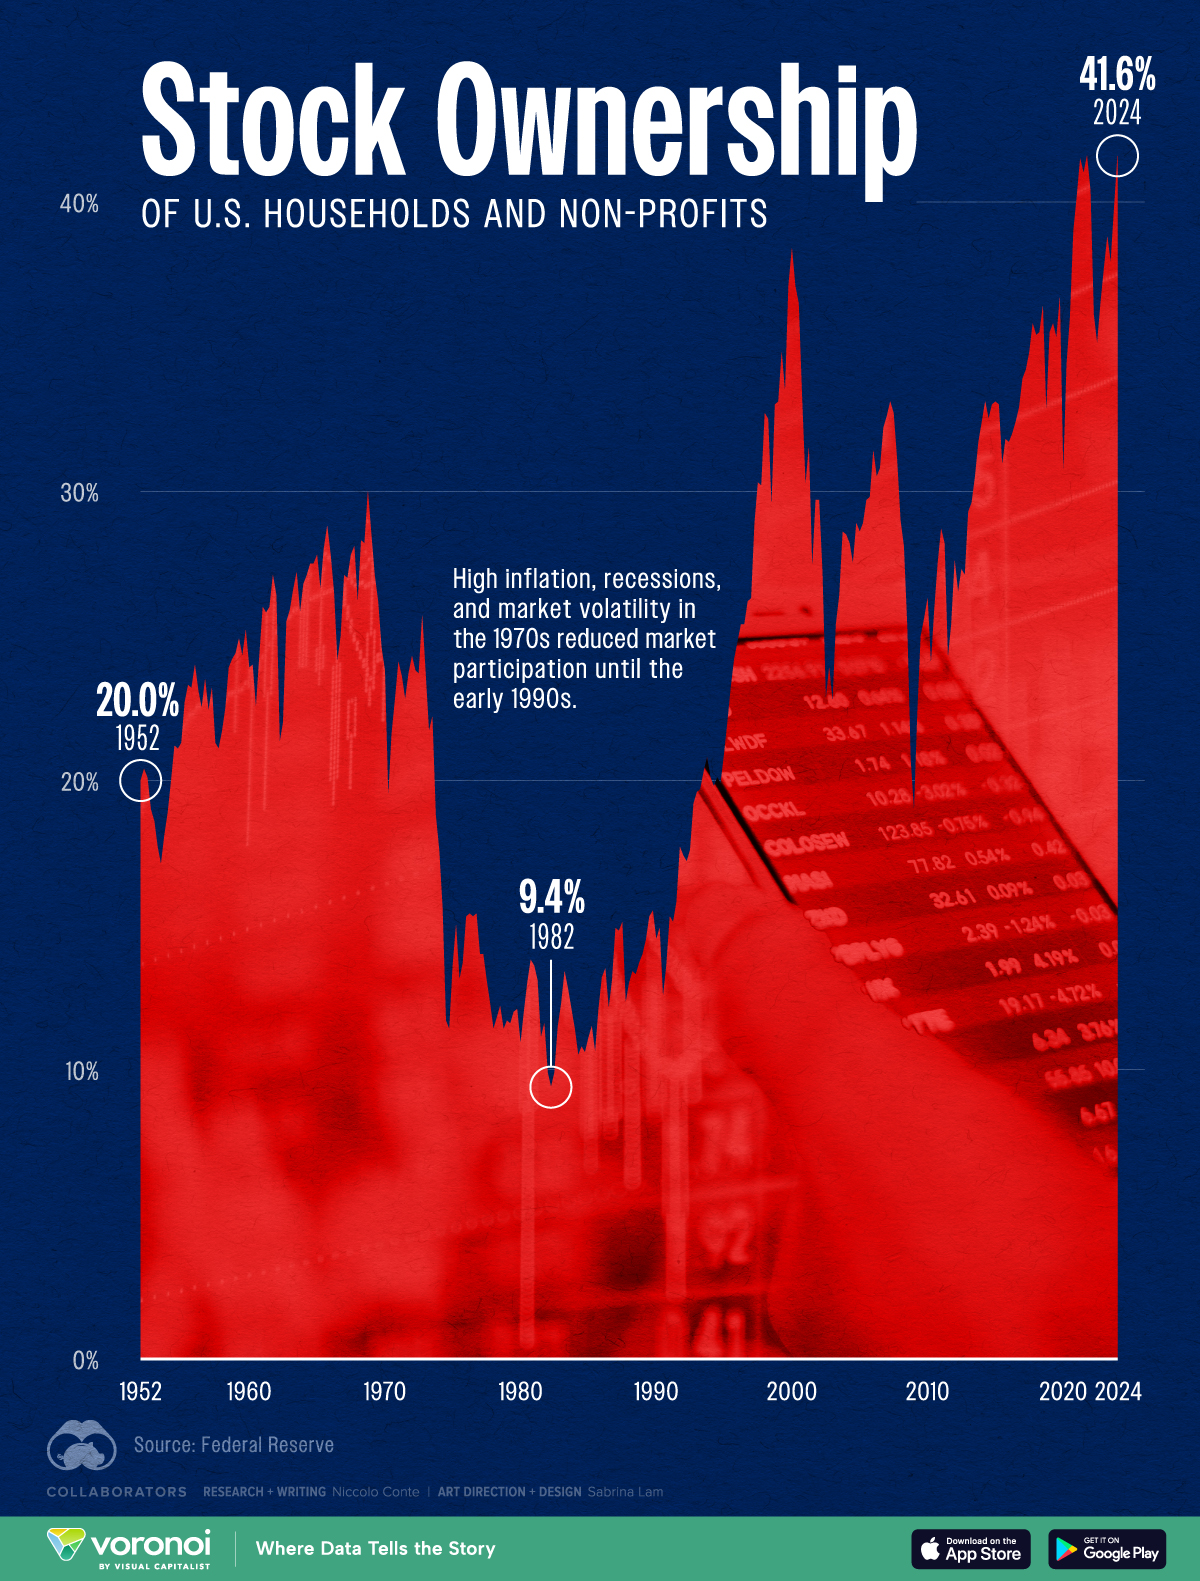
Investor confidence, a strong U.S. economy, and superior historical performance over the last several decades is driving allocations to equities. In 2024, 41.6% of U.S. households’ financial assets are tied to the stock market.
This graphic shows the share of U.S. households’ finances invested in public stocks over time, based on data from the Federal Reserve.
Americans Are Investing More in Equities
Below, we show the share of financial assets invested in the stock market over each decade:
| Date | U.S. Households and Non-ProfitsStock Ownership as a % of Financial Assets |
|---|---|
| 2024 | 41.6% |
| 2020 | 30.5% |
| 2010 | 26.3% |
| 2000 | 38.4% |
| 1990 | 14.5% |
| 1980 | 10.9% |
| 1970 | 23.8% |
| 1960 | 23.9% |
Figures are as of January 1 of each year.
As we can see, more Americans are investing a greater share of their wealth in public stocks at a time of high inflation and robust consumer spending.
Currently, 62% of Americans own stocks, reaching a 20-year high. Breaking it down further, 87% of upper-income Americans own stocks, followed by 65% of middle-income Americans, and 25% of lower-income individuals. In the first quarter alone of 2024, the value of assets held in the stock market jumped by $3.8 trillion compared to the previous quarter.
Similarly, a significant share of Americans invested in stocks during the internet bubble. This fell sharply after the crash as investors were hurt by making risky investments in high-flying tech companies. Often, these companies had no earnings or viable business models.
On the other hand, the share of assets held in stocks plummeted to 9.4% in 1982, a year when 10-year Treasury bonds delivered a record return of 32.8%. For context, these returns outpaced the S&P 500 by 12.4% amid soaring interest rates. At the time, the U.S. economy was marked by a recession and high inflation, leading investors to seek less risky assets.
Comparing Asset Class Performance
One reason why investors have flocked to equities is because of the historical performance track record.
When compared to nearly all other asset classes, U.S. equities have outperformed for decades. Looking at the last 10 years, U.S. stocks returned 12.3% annually on average compared to 4% for real estate investment trusts (REITS), and 1.4% for investment-grade corporate bonds.
Even beyond America’s borders, domestic equities have seen higher returns. Since 2014, European equities have seen 4.6% annualized returns while emerging market stocks have returned 3.3% on average.
The post Charted: American Stock Ownership Back at All-Time Highs appeared first on Visual Capitalist.