![]()
See this visualization first on the Voronoi app.
Use This Visualization
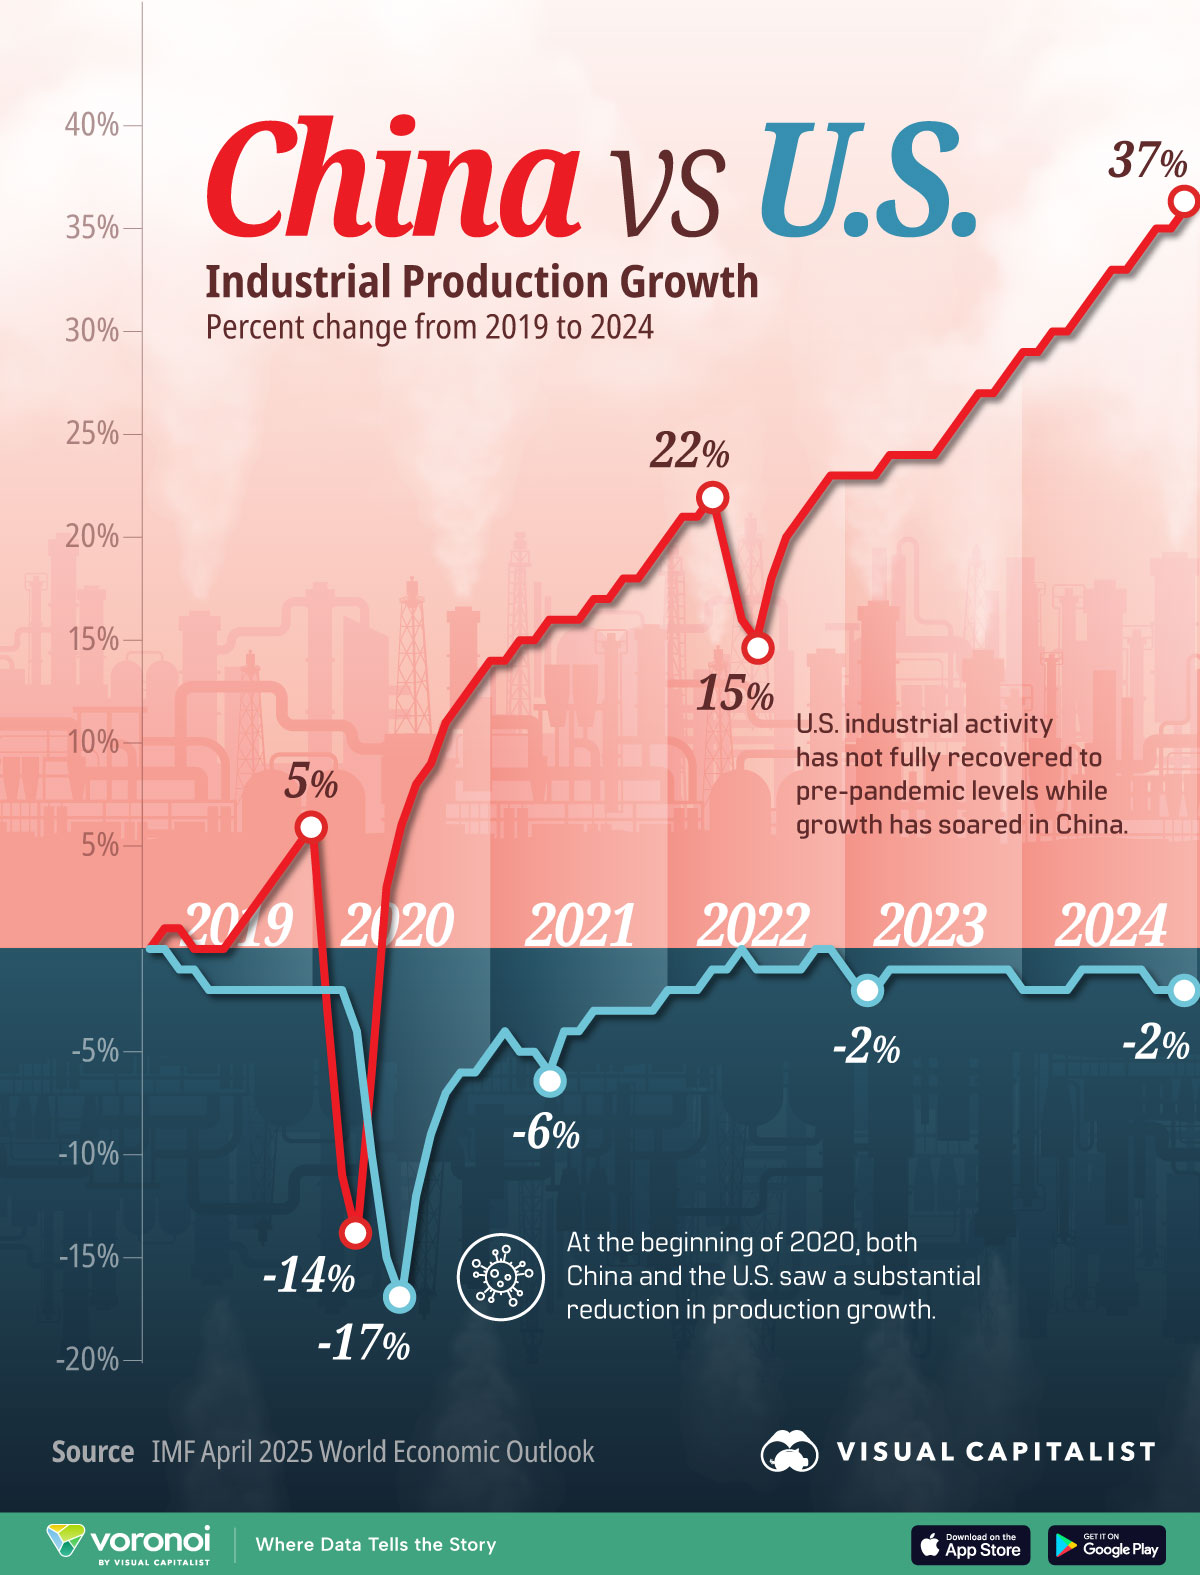
The Divergence of China and America’s Industrial Growth
This was originally posted on our Voronoi app. Download the app for free on iOS or Android and discover incredible data-driven charts from a variety of trusted sources.
Key Takeaways
- Despite two economic downturns since 2019, China’s industrial activity has surged, further cementing its role as the world’s largest exporter.
- Between 2019 and mid-2024, China’s economy expanded by 20%, supported by its manufacturing base.
- By contrast, American industrial activity has lagged, with the manufacturing sector employing 8% of the population, roughly half the share seen in China.
Over the past five years, industrial growth in China and America tell two very different stories.
While China’s factories ramped up output, the U.S. industrial sector has struggled to regain momentum. Even with booming oil production, broader manufacturing and industrial activity in America has yet to return to 2019 levels.
This graphic shows the industrial production growth of China and America since 2019, based on data from the IMF’s April 2025 World Economic Outlook.
China’s Industrial Production Boom
Industrial production covers three key sectors—manufacturing, mining, and utilities—spanning from finished goods to the extraction of resources.
Since 2019, China’s industrial activity increased by 37%, fueled by the EV sector, rising demand for critical minerals, and photovoltaic modules. As the largest driver of the Chinese economy, the value of industrial production reached $5.6 trillion in 2024.
Below, we show how China’s industrial production growth has surged past America in the past five years:
| Date | U.S. % Change | China % Change |
|---|---|---|
| 2019M1 | 0.0% | 0.0% |
| 2019M2 | -0.4% | 0.5% |
| 2019M3 | -0.9% | 1.2% |
| 2019M4 | -1.4% | 0.4% |
| 2019M5 | -1.6% | 0.1% |
| 2019M6 | -1.7% | -0.1% |
| 2019M7 | -1.8% | 1.3% |
| 2019M8 | -1.6% | 2.4% |
| 2019M9 | -1.9% | 3.3% |
| 2019M10 | -2.2% | 4.2% |
| 2019M11 | -2.4% | 5.0% |
| 2019M12 | -2.4% | 5.8% |
| 2020M1 | -2.2% | -2.5% |
| 2020M2 | -2.2% | -11.3% |
| 2020M3 | -3.7% | -13.6% |
| 2020M4 | -9.9% | -5.7% |
| 2020M5 | -15.0% | 2.9% |
| 2020M6 | -16.5% | 5.5% |
| 2020M7 | -12.1% | 7.6% |
| 2020M8 | -8.5% | 9.2% |
| 2020M9 | -7.0% | 10.9% |
| 2020M10 | -6.3% | 12.1% |
| 2020M11 | -5.9% | 13.2% |
| 2020M12 | -5.2% | 13.9% |
| 2021M1 | -4.4% | 14.3% |
| 2021M2 | -5.2% | 14.6% |
| 2021M3 | -5.2% | 15.1% |
| 2021M4 | -5.6% | 15.6% |
| 2021M5 | -4.2% | 16.0% |
| 2021M6 | -3.8% | 16.1% |
| 2021M7 | -3.1% | 16.6% |
| 2021M8 | -3.0% | 17.1% |
| 2021M9 | -3.1% | 17.5% |
| 2021M10 | -3.1% | 17.9% |
| 2021M11 | -2.6% | 18.5% |
| 2021M12 | -1.8% | 19.6% |
| 2022M1 | -1.7% | 20.6% |
| 2022M2 | -1.6% | 21.4% |
| 2022M3 | -1.2% | 21.7% |
| 2022M4 | -0.6% | 18.5% |
| 2022M5 | -0.3% | 16.2% |
| 2022M6 | -0.5% | 15.3% |
| 2022M7 | -0.7% | 18.0% |
| 2022M8 | -0.7% | 19.8% |
| 2022M9 | -0.5% | 21.2% |
| 2022M10 | -0.3% | 22.2% |
| 2022M11 | -0.4% | 22.7% |
| 2022M12 | -1.3% | 22.8% |
| 2023M1 | -1.5% | 22.9% |
| 2023M2 | -1.5% | 23.2% |
| 2023M3 | -1.2% | 24.1% |
| 2023M4 | -1.1% | 24.0% |
| 2023M5 | -1.1% | 24.3% |
| 2023M6 | -1.1% | 24.3% |
| 2023M7 | -1.3% | 25.1% |
| 2023M8 | -1.3% | 25.9% |
| 2023M9 | -1.2% | 26.6% |
| 2023M10 | -1.4% | 27.3% |
| 2023M11 | -1.4% | 28.0% |
| 2023M12 | -1.5% | 28.6% |
| 2024M1 | -1.8% | 29.3% |
| 2024M2 | -1.8% | 29.9% |
| 2024M3 | -1.7% | 30.4% |
| 2024M4 | -1.4% | 31.2% |
| 2024M5 | -1.4% | 31.8% |
| 2024M6 | -1.4% | 32.6% |
| 2024M7 | -1.4% | 33.2% |
| 2024M8 | -1.4% | 33.8% |
| 2024M9 | -1.6% | 34.6% |
| 2024M10 | -1.7% | 35.4% |
| 2024M11 | -1.9% | 36.3% |
| 2024M12 | -1.8% | 37.2% |
Since 2019, China’s industrial production growth consistently outpaced the U.S., save for three months in 2020.
Amid surging EV production, China now holds 62% of the global market share, including 82% of Brazil’s market, 70% of Mexico’s, and 42% of Chile’s. Additionally, China produces 80% of the world’s lithium-ion batteries, bolstered by significant government policy support.
Given escalating trade tensions with the U.S., China continues to diversify its export markets. Even before the current wave of tariffs, it had expanded trade relationships with countries like Vietnam, Thailand, and Indonesia. As a result, under 15% of China’s exports are sent to the U.S.—falling from nearly a fifth in 2017.
Learn More on the Voronoi App ![]()
To learn more about this topic from a manufacturing-based perspective, check out this graphic on China’s dominance in global manufacturing output.