![]()
Published
43 seconds ago
on
September 3, 2024
| 48 views
-->
By
Alan Kennedy
Article & Editing
- Chris Dickert
See this visualization first on the Voronoi app.
The Cost of Mining Silver by Region, 2021–2023
This was originally posted on our Voronoi app. Download the app for free on iOS or Android and discover incredible data-driven charts from a variety of trusted sources.
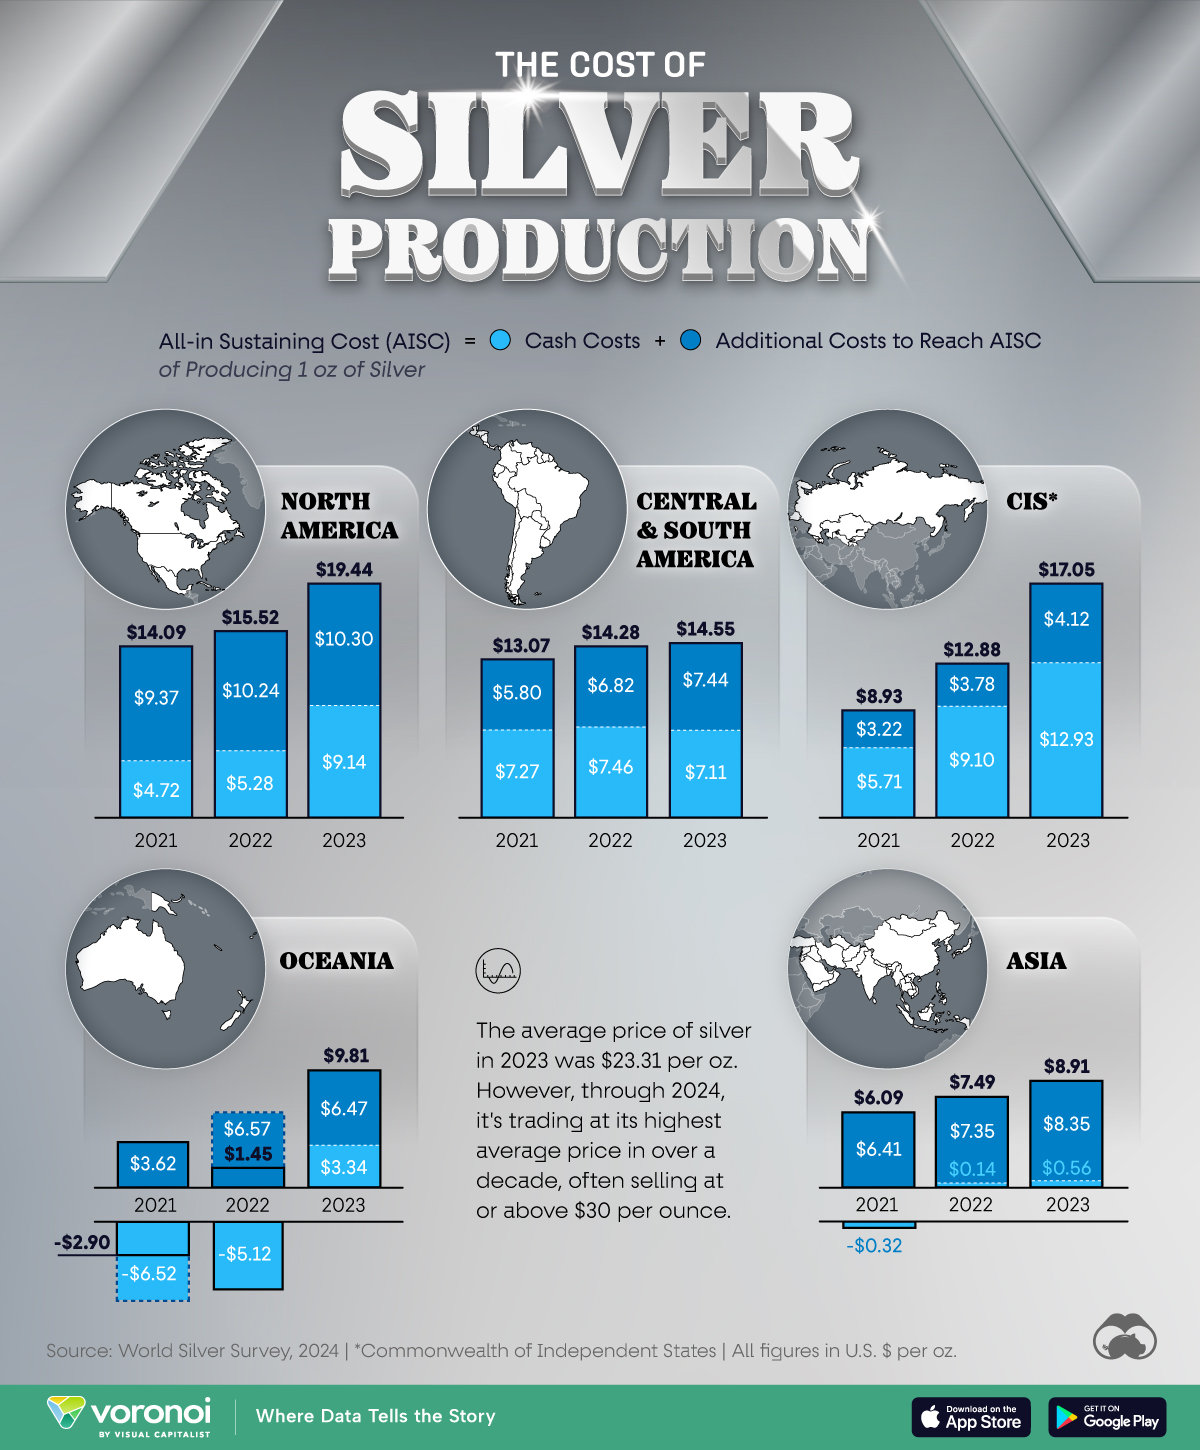
In this visualization, we look at how much it cost to mine an ounce of silver in five world regions based on data from the 2024 World Silver Survey.
How Much Does it Cost to Mine an Ounce of Silver?
Below we break down regional costs for the years 2021, 2022, and 2023, using two measures:
Total cash costs (TCC) include all direct and indirect costs incurred during the physical process of mining the silver.
All-in sustaining costs (AISC) include all cash costs, as well as capital costs, corporate and administrative expenses, and the cost of exploration.
| Region | 2021 | 2022 | 2023 |
|---|---|---|---|
| North America | |||
| Total Cash Costs | $4.72 | $5.28 | $9.14 |
| All-in Sustaining Costs | $14.09 | $15.52 | $19.44 |
| Central & South America | |||
| Total Cash Costs | $7.27 | $7.46 | $7.11 |
| All-in Sustaining Costs | $13.07 | $14.28 | $14.55 |
| Commonwealth of Independent States | |||
| Total Cash Costs | $5.71 | $9.10 | $12.93 |
| All-in Sustaining Costs | $8.93 | $12.88 | $17.05 |
| Asia | |||
| Total Cash Costs | -$0.32 | $0.14 | $0.56 |
| All-in Sustaining Costs | $6.09 | $7.49 | $8.91 |
| Oceania | |||
| Total Cash Costs | -$6.52 | -$5.12 | $3.34 |
| All-in Sustaining Costs | -$2.90 | $1.45 | $9.81 |
Source: World Silver Report, 2024 | USD per ounce silver on a by-product accounting basis | Direct mining costs = Total cash costs (TCC) | All other costs associated with mining = All-in-sustaining costs (AISC)
Silver Production by Region
North American average production costs rose for the fourth year in a row, to $9.14 in TCC and $19.44 in AISC, driven in part by the appreciation of the Mexican peso against the U.S. dollar and high inflation. In 2023, local inflation in Mexico eased to 5.5%, and to 4.1% in the U.S., which is still above the historical average.
In 2023, Central and South America was home to the third, fourth, fifth, and tenth largest producing countries, Peru, Chile, Bolivia, and Argentina, respectively. Regionally, costs were almost flat year-over-year, as ameliorating inflation was offset by strengthening exchange rates, including the Peruvian sol.
In the land down under, easing inflation and a weakening of the Australian dollar against its U.S. counterpart increased cash costs and AISC above zero. Lead and zinc by-product revenues often help offset silver costs, sometimes even turning them “negative” as they were in 2021.
The data for this visualization was sourced from the World Silver Survey 2024, a publication by one of our data partners, The Silver Institute. Our data partnerships are commercial agreements that may or may not include compensation, and partners are not involved with our editorial or graphical processes in any capacity.
![]()

Please enable JavaScript in your browser to complete this form.Enjoying the data visualization above? *Subscribe
Related Topics: #silver #zinc #lead #asia #north america #oceania #CIS #mining costs
Click for Comments
var disqus_shortname = "visualcapitalist.disqus.com";
var disqus_title = "Charted: The Cost of Producing Silver, by Region (2021-2023)";
var disqus_url = "https://www.visualcapitalist.com/dp/si01-rising-cost-of-silver-by-region/";
var disqus_identifier = "visualcapitalist.disqus.com-169441";
You may also like
-
Markets1 week ago
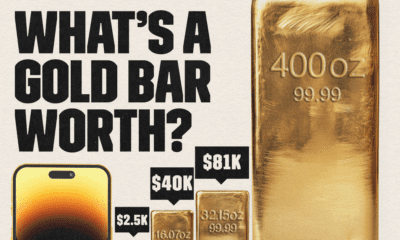
A Gold Bar is Now Worth $1 Million, Thanks to Record-High Gold Prices
With gold prices hitting all-time highs in August, what is the value of a gold bar today?
-
Economy2 weeks ago
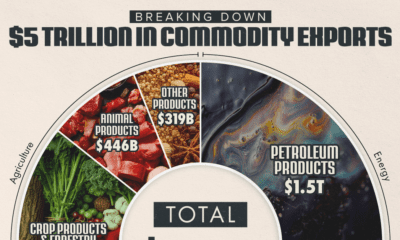
Charted: $5 Trillion in Global Commodity Exports, by Sector
The energy sector accounts for 40% of the value of global commodity exports. And there’s a key product within it that dominates international trade.
-
Central Banks2 weeks ago
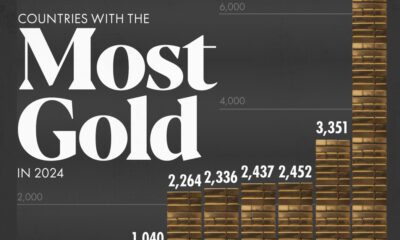
The Top 10 Countries by Gold Reserves in 2024
The U.S. ranks first with more than double the reserves of second-place Germany.
-
Mining3 weeks ago
Visualizing the Growth of Chinese Copper Miners
Chinese miners are set to overtake major producers by 2025.
-

Mining3 months ago
Visualizing Raw Steel Production in 2023
China produces more than half the world’s steel.
-
Mining3 months ago
Visualizing Cobalt Production by Country in 2023
The Democratic Republic of Congo accounts for 74% of the world’s cobalt output.
Subscribe
Please enable JavaScript in your browser to complete this form.Join the 375,000+ subscribers who receive our daily email *Sign Up
The post Charted: The Cost of Producing Silver, by Region (2021-2023) appeared first on Visual Capitalist.