Charting the Movement of Global Plastic Waste
Every year, nations worldwide produce around 350 million metric tons of plastic waste. This is equivalent to over 10 million fully loaded garbage trucks.
Most of this plastic waste is either incinerated or sent to landfills, thus eventually polluting our air, land, and oceans. Only a fraction of this waste is recycled, and contrary to popular belief, just 2% is traded internationally.
This graphic by Our World in Data uses data from OECD and UN Comtrade to reveal just how much plastic waste is traded across borders, and which countries are estimated to export and import the most of it.
Why Trade Waste?
Though most plastic waste is managed and recycled within countries, exporting spare waste helps manage a part of their plastic emissions more cheaply and reduces pressure on local recycling facilities and landfills.
Importing plastics, on the other hand, comes with certain financial benefits too. Repurposing recycled plastics into goods is a far cheaper option for industries that would otherwise rely on buying newly manufactured expensive plastics. And many countries differ when it comes to their specific plastic recycling capabilities and needs, so while they might export some plastic waste, they also import others that are useful.
https://ourworldindata.org/explorers/plastic-pollution
Research has even found that higher plastic waste imports have positively impacted the economic growth of many low-income countries, in the right circumstances.
However, when countries export unusable and non-recyclable contaminated plastics, these same low-income nations may see the end-of-life ecosystem costs outweigh any financial benefits.
The World’s Biggest Plastic Importers and Exporters
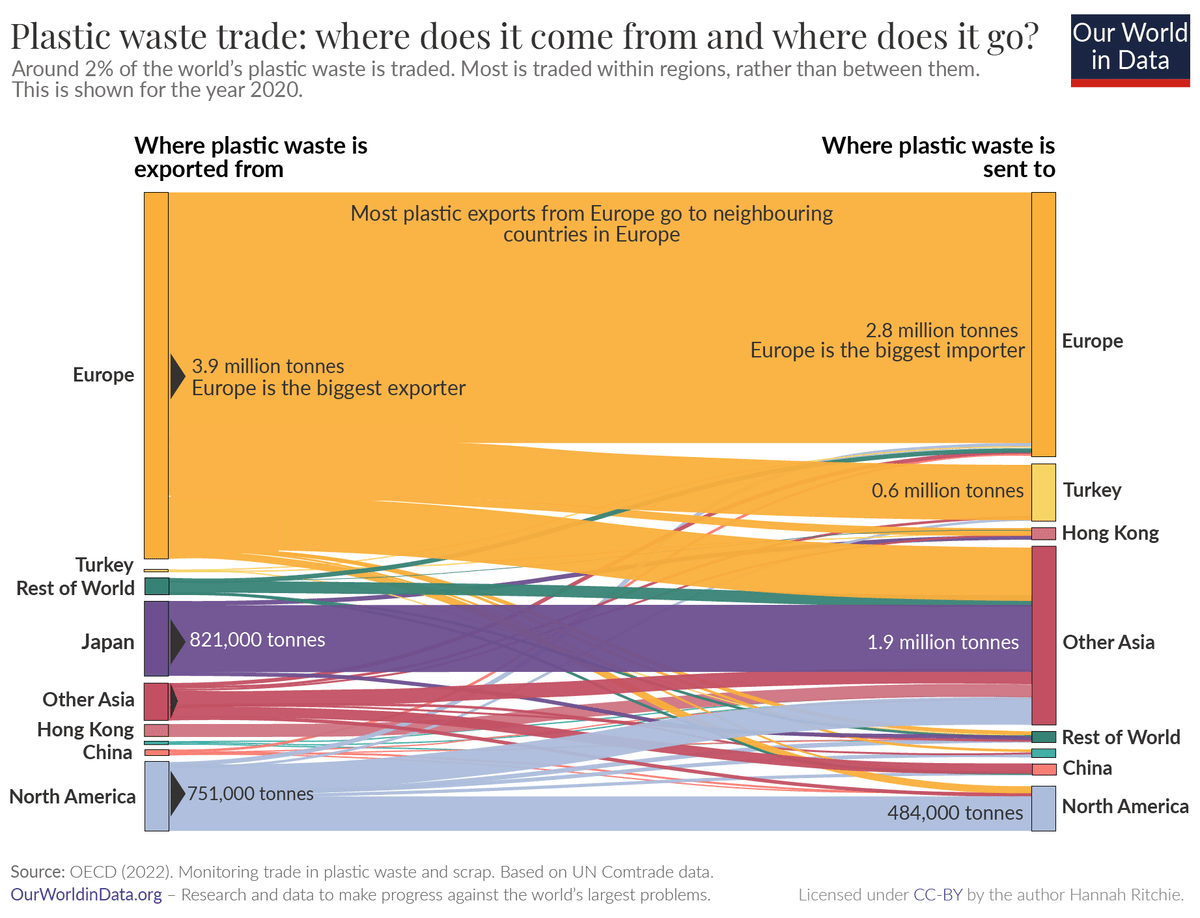
With its reported plastic waste exports nearing four million metric tons, Europe exports nearly 80% of the world’s traded plastic waste. However, as most is reportedly exported to other European nations, it is also the largest importing region.
Here are the world’s top plastic waste exporters in 2020 according to UN Comtrade data:
| Rank | Country | Exported Plastic Waste (2020) |
|---|---|---|
| 1 | Germany | 853,860,858 kg |
| 2 | Japan | 820,742,495 kg |
| 3 | USA | 624,511,072 kg |
| 4 | United Kingdom | 560,986,540 kg |
| 5 | Netherlands | 413,233,255 kg |
| 6 | Belgium | 346,218,522 kg |
| 7 | France | 333,748,686 kg |
| 8 | Italy | 217,167,070 kg |
| 9 | Slovenia | 181,914,979 kg |
| 10 | Austria | 179,322,638 kg |
| 11 | Poland | 155,891,362 kg |
| 12 | Canada | 150,206,837 kg |
| 13 | China, Hong Kong SAR | 112,080,263 kg |
| 14 | Sweden | 111,514,132 kg |
| 15 | Australia | 100,204,277 kg |
| 16 | Czechia | 89,082,929 kg |
| 17 | Spain | 86,854,314 kg |
| 18 | Thailand | 85,385,733 kg |
| 19 | Switzerland | 83,005,449 kg |
| 20 | Philippines | 75,168,153 kg |
| 21 | Nigeria | 74,639,859 kg |
| 22 | Norway | 71,372,606 kg |
| 23 | Denmark | 55,662,774 kg |
| 24 | Greece | 53,393,857 kg |
| 25 | Portugal | 53,003,217 kg |
| 26 | China | 50,478,220 kg |
| 27 | Ireland | 48,751,674 kg |
| 28 | Indonesia | 43,724,756 kg |
| 29 | Other Asia, nes | 43,457,341 kg |
| 30 | Viet Nam | 37,175,812 kg |
| 31 | Singapore | 34,704,348 kg |
| 32 | Croatia | 32,316,215 kg |
| 33 | Romania | 29,700,995 kg |
| 34 | Lithuania | 28,983,059 kg |
| 35 | Republic of Korea | 28,904,472 kg |
| 36 | Slovakia | 27,652,928 kg |
| 37 | Russian Federation | 25,644,305 kg |
| 38 | Mexico | 24,702,933 kg |
| 39 | Saudi Arabia | 23,481,323 kg |
| 40 | New Zealand | 22,480,990 kg |
| 41 | Israel | 21,643,157 kg |
| 42 | Malaysia | 19,027,615 kg |
| 43 | Latvia | 17,866,739 kg |
| 44 | Estonia | 16,294,944 kg |
| 45 | Finland | 15,249,438 kg |
| 46 | Dominican Republic | 14,719,180 kg |
| 47 | Turkey | 14,523,187 kg |
| 48 | United Republic of Tanzania | 14,479,176 kg |
| 49 | Belarus | 13,835,708 kg |
| 50 | Nicaragua | 11,514,077 kg |
| 51 | Luxembourg | 10,803,768 kg |
| 52 | Iceland | 10,672,493 kg |
| 53 | Cyprus | 9,892,697 kg |
| 54 | Chile | 9,794,134 kg |
| 55 | Bulgaria | 9,617,547 kg |
| 56 | Jamaica | 9,017,513 kg |
| 57 | Costa Rica | 8,825,189 kg |
| 58 | Serbia | 7,760,215 kg |
| 59 | El Salvador | 7,419,495 kg |
| 60 | Myanmar | 7,249,896 kg |
| 61 | Cambodia | 6,951,533 kg |
| 62 | Lebanon | 6,415,630 kg |
| 63 | Bosnia Herzegovina | 6,007,289 kg |
| 64 | Kazakhstan | 5,653,113 kg |
| 65 | Guatemala | 5,379,563 kg |
| 66 | Ethiopia | 4,713,442 kg |
| 67 | Senegal | 4,642,680 kg |
| 68 | Uganda | 4,418,835 kg |
| 69 | Mauritania | 4,295,751 kg |
| 70 | Pakistan | 4,290,080 kg |
| 71 | Kenya | 3,840,457 kg |
| 72 | India | 3,819,791 kg |
| 73 | Colombia | 3,804,346 kg |
| 74 | United Arab Emirates | 3,772,818 kg |
| 75 | Ecuador | 3,483,956 kg |
| 76 | North Macedonia | 3,477,001 kg |
| 77 | Panama | 3,317,193 kg |
| 78 | Lao People's Democratic Republic | 3,124,150 kg |
| 79 | Tajikistan | 3,062,960 kg |
| 80 | Morocco | 3,026,647 kg |
| 81 | Kuwait | 2,407,677 kg |
| 82 | Namibia | 2,353,190 kg |
| 83 | Brazil | 2,347,776 kg |
| 84 | Ukraine | 2,278,326 kg |
| 85 | Hungary | 2,249,520 kg |
| 86 | South Africa | 2,079,115 kg |
| 87 | Barbados | 1,859,440 kg |
| 88 | Rwanda | 1,805,214 kg |
| 89 | Kyrgyzstan | 1,775,603 kg |
| 90 | Oman | 1,721,228 kg |
| 91 | Zambia | 1,699,478 kg |
| 92 | Mauritius | 1,517,428 kg |
| 93 | Mozambique | 1,470,146 kg |
| 94 | Egypt | 1,348,091 kg |
| 95 | Malta | 1,282,539 kg |
| 96 | Burkina Faso | 1,225,000 kg |
| 97 | Uruguay | 1,114,915 kg |
| 98 | Paraguay | 1,003,800 kg |
| 99 | Bolivia (Plurinational State of) | 740,180 kg |
| 100 | Trinidad and Tobago | 658,955 kg |
| 101 | Eswatini | 649,645 kg |
| 102 | Georgia | 643,683 kg |
| 103 | French Polynesia | 577,460 kg |
| 104 | Sri Lanka | 483,401 kg |
| 105 | Botswana | 482,755 kg |
| 106 | Jordan | 440,681 kg |
| 107 | Belize | 368,658 kg |
| 108 | Togo | 366,264 kg |
| 109 | China, Macao SAR | 350,362 kg |
| 110 | Azerbaijan | 300,000 kg |
| 111 | Peru | 250,030 kg |
| 112 | Zimbabwe | 200,001 kg |
| 113 | Benin | 190,360 kg |
| 114 | Uzbekistan | 188,430 kg |
| 115 | Montenegro | 171,132 kg |
| 116 | Republic of Moldova | 169,735 kg |
| 117 | Fiji | 155,396 kg |
| 118 | Burundi | 111,370 kg |
| 119 | Congo | 94,000 kg |
| 120 | Grenada | 49,504 kg |
| 121 | Brunei Darussalam | 39,660 kg |
| 122 | Malawi | 25,709 kg |
| 123 | Cayman Isds | 1,435 kg |
| 124 | Lesotho | 133 kg |
| 125 | Guyana | 100 kg |
| 126 | Democratic Republic of the Congo | 33 kg |
| 127 | Armenia | 1 kg |
Due to political reasons, UN Comtrade includes Taiwan data under “Other Asia, not elsewhere specified.”
Germany, which is the world’s largest exporter of plastic scraps and waste at 854 million kilograms, relies primarily on the Netherlands, Poland, Austria, Switzerland, Türkiye, and Malaysia to manage this plastic waste.
Asia’s largest plastic exports are from Japan, which trades primarily with other Asian countries including Malaysia, Vietnam, Thailand, and Korea. In 2020, Japan was the world’s second-largest plastic waste exporter with 821 million kilograms shipped.
Third on this list is the United States. The country is estimated to have exported more than 600 million kilograms of plastic waste in 2020, and while a majority was traded with Canada, a portion also went to Mexico, Malaysia, Vietnam, India, Hong Kong, and Indonesia.
And on the receiving end, Malaysia and Türkiye have become the world’s largest plastic waste importers, primarily from within their respective regions:
| Rank | Country | Imported Plastic Waste (2020) |
|---|---|---|
| 1 | Malaysia | 715,274,628 kg |
| 2 | Türkiye | 619,287,422 kg |
| 3 | Germany | 567,239,848 kg |
| 4 | Viet Nam | 440,706,678 kg |
| 5 | Netherlands | 417,312,448 kg |
| 6 | USA | 243,981,665 kg |
| 7 | Indonesia | 233,926,526 kg |
| 8 | Other Asia, nes | 230,934,455 kg |
| 9 | Poland | 195,332,771 kg |
| 10 | Italy | 192,114,936 kg |
| 11 | China, Hong Kong SAR | 186,629,825 kg |
| 12 | Belgium | 185,232,530 kg |
| 13 | Spain | 182,033,579 kg |
| 14 | Austria | 170,175,178 kg |
| 15 | Canada | 167,123,643 kg |
| 16 | China | 150,033,032 kg |
| 17 | United Kingdom | 144,482,263 kg |
| 18 | Thailand | 130,341,730 kg |
| 19 | France | 128,752,962 kg |
| 20 | Slovenia | 102,353,864 kg |
| 21 | Rep. of Korea | 97,893,699 kg |
| 22 | India | 89,145,346 kg |
| 23 | Czechia | 79,601,672 kg |
| 24 | Mexico | 68,782,729 kg |
| 25 | Latvia | 68,107,317 kg |
| 26 | Lithuania | 66,374,140 kg |
| 27 | Bulgaria | 63,823,882 kg |
| 28 | Switzerland | 61,347,327 kg |
| 29 | Ireland | 54,078,049 kg |
| 30 | Romania | 47,989,380 kg |
| 31 | Pakistan | 45,750,791 kg |
| 32 | Serbia | 37,292,746 kg |
| 33 | Denmark | 33,324,445 kg |
| 34 | Russian Federation | 31,817,270 kg |
| 35 | Ukraine | 30,817,214 kg |
| 36 | Sweden | 30,007,480 kg |
| 37 | Slovakia | 29,347,402 kg |
| 38 | Uzbekistan | 27,090,552 kg |
| 39 | Greece | 22,635,566 kg |
| 40 | Bosnia Herzegovina | 21,829,094 kg |
| 41 | Hungary | 21,118,259 kg |
| 42 | Portugal | 19,953,840 kg |
| 43 | Honduras | 18,408,892 kg |
| 44 | Luxembourg | 16,654,349 kg |
| 45 | Australia | 13,731,068 kg |
| 46 | Bangladesh | 13,344,977 kg |
| 47 | Myanmar | 13,084,157 kg |
| 48 | Croatia | 13,046,429 kg |
| 49 | Brazil | 12,040,500 kg |
| 50 | Philippines | 10,964,992 kg |
| 51 | Ecuador | 10,012,297 kg |
| 52 | El Salvador | 9,934,333 kg |
| 53 | Nigeria | 8,975,285 kg |
| 54 | South Africa | 8,290,544 kg |
| 55 | United Arab Emirates | 8,194,024 kg |
| 56 | Yemen | 8,122,620 kg |
| 57 | Kenya | 8,042,308 kg |
| 58 | Finland | 7,927,225 kg |
| 59 | Peru | 7,830,729 kg |
| 60 | Singapore | 7,812,335 kg |
| 61 | Saudi Arabia | 7,772,952 kg |
| 62 | Norway | 7,465,358 kg |
| 63 | Oman | 7,337,017 kg |
| 64 | Morocco | 6,354,623 kg |
| 65 | Israel | 5,435,111 kg |
| 66 | Estonia | 5,112,549 kg |
| 67 | Azerbaijan | 5,059,007 kg |
| 68 | New Zealand | 4,986,243 kg |
| 69 | Lao People's Dem. Rep. | 4,896,151 kg |
| 70 | Ghana | 4,525,868 kg |
| 71 | Egypt | 4,265,787 kg |
| 72 | Angola | 3,848,302 kg |
| 73 | Guatemala | 3,786,378 kg |
| 74 | Cyprus | 3,699,497 kg |
| 75 | Belarus | 3,363,907 kg |
| 76 | Japan | 3,045,561 kg |
| 77 | Mozambique | 2,828,608 kg |
| 78 | United Rep. of Tanzania | 2,801,914 kg |
| 79 | Costa Rica | 2,584,350 kg |
| 80 | Nicaragua | 2,400,367 kg |
| 81 | Paraguay | 2,128,994 kg |
| 82 | Colombia | 2,037,539 kg |
| 83 | South Sudan | 1,709,764 kg |
| 84 | Uganda | 1,559,662 kg |
| 85 | Zimbabwe | 1,511,063 kg |
| 86 | Sri Lanka | 1,502,126 kg |
| 87 | Senegal | 1,362,546 kg |
| 88 | North Macedonia | 1,126,010 kg |
| 89 | Côte d'Ivoire | 939,404 kg |
| 90 | Dominican Rep. | 768,374 kg |
| 91 | Afghanistan | 754,746 kg |
| 92 | Kazakhstan | 717,188 kg |
| 93 | Togo | 698,210 kg |
| 94 | Cuba | 680,609 kg |
| 95 | Iraq | 627,911 kg |
| 96 | Lebanon | 583,037 kg |
| 97 | Montenegro | 571,380 kg |
| 98 | Uruguay | 505,549 kg |
| 99 | Bahrain | 499,397 kg |
| 100 | Ethiopia | 493,057 kg |
| 101 | Panama | 454,236 kg |
| 102 | Djibouti | 447,649 kg |
| 103 | Libya | 445,997 kg |
| 104 | Nepal | 430,028 kg |
| 105 | Tajikistan | 405,577 kg |
| 106 | Kyrgyzstan | 389,064 kg |
| 107 | Georgia | 379,580 kg |
| 108 | Chad | 375,055 kg |
| 109 | Areas, nes | 366,189 kg |
| 110 | Chile | 348,504 kg |
| 111 | Qatar | 289,691 kg |
| 112 | Guinea | 247,240 kg |
| 113 | Venezuela | 239,537 kg |
| 114 | Zambia | 233,551 kg |
| 115 | Burkina Faso | 193,232 kg |
| 116 | Sudan | 188,732 kg |
| 117 | Mauritius | 176,928 kg |
| 118 | Benin | 168,956 kg |
| 119 | Malta | 157,233 kg |
| 120 | Jamaica | 150,529 kg |
| 121 | Tunisia | 149,199 kg |
| 122 | Democratic Republic of the Congo | 147,105 kg |
| 123 | Cambodia | 143,448 kg |
| 124 | Cameroon | 137,262 kg |
| 125 | Gabon | 136,495 kg |
| 126 | Iran | 129,535 kg |
| 127 | Kuwait | 104,493 kg |
| 128 | Algeria | 86,902 kg |
| 129 | Brunei Darussalam | 83,517 kg |
| 130 | Albania | 83,138 kg |
| 131 | Rwanda | 82,091 kg |
| 132 | Armenia | 71,820 kg |
| 133 | Democratic People's Republic of Korea | 66,000 kg |
| 134 | Bhutan | 52,653 kg |
| 135 | Cayman Isds | 52,513 kg |
| 136 | Equatorial Guinea | 44,051 kg |
| 137 | Bolivia (Plurinational State of) | 42,858 kg |
| 138 | Argentina | 38,707 kg |
| 139 | Namibia | 33,211 kg |
| 140 | Trinidad and Tobago | 31,811 kg |
| 141 | Jordan | 28,770 kg |
| 142 | Suriname | 22,976 kg |
| 143 | Madagascar | 22,672 kg |
| 144 | Syria | 22,100 kg |
| 145 | Andorra | 20,387 kg |
| 146 | Mali | 20,200 kg |
| 147 | Saint Helena | 19,587 kg |
| 148 | Mongolia | 19,111 kg |
| 149 | Bermuda | 18,814 kg |
| 150 | Maldives | 18,130 kg |
| 151 | Botswana | 16,041 kg |
| 152 | Timor-Leste | 12,459 kg |
| 153 | Saint Lucia | 10,739 kg |
| 154 | Mauritania | 10,300 kg |
| 155 | Saint Vincent and the Grenadines | 8,281 kg |
| 156 | Haiti | 7,769 kg |
| 157 | Aruba | 5,833 kg |
| 158 | Malawi | 5,716 kg |
| 159 | Vanuatu | 5,000 kg |
| 160 | Belize | 4,294 kg |
| 161 | Eswatini | 3,730 kg |
| 162 | Turks and Caicos Isds | 3,453 kg |
| 163 | Fiji | 3,212 kg |
| 164 | Curaçao | 1,485 kg |
| 165 | Bahamas | 1,361 kg |
| 166 | Faeroe Isds | 1,062 kg |
| 167 | Guyana | 1,004 kg |
| 168 | Lesotho | 547 kg |
| 169 | Bonaire | 392 kg |
| 170 | Gibraltar | 380 kg |
| 171 | Papua New Guinea | 191 kg |
| 172 | Guam | 140 kg |
| 173 | Cabo Verde | 100 kg |
| 174 | New Caledonia | 73 kg |
| 175 | Liberia | 50 kg |
| 176 | Bunkers | 50 kg |
| 177 | Cocos Isds | 44 kg |
| 178 | Br. Virgin Isds | 35 kg |
| 179 | Republic of Moldova | 31 kg |
| 180 | Saint Pierre and Miquelon | 5 kg |
| 181 | Iceland | 3 kg |
| 182 | Seychelles | 2 kg |
| 183 | Sierra Leone | 1 kg |
How the Plastic Waste Trade is Changing
Up until 2017, China was one of the world’s largest plastic waste importers, which it used for its manufacturing industries. In 2018, it imposed import bans on 24 types of recyclable waste, and their plastic waste imports dropped by over 95% within a year.
https://ourworldindata.org/explorers/plastic-pollution
In 2019, 187 nations signed an international treaty called the Basel Convention on the Control of Transboundary Movements of Hazardous Wastes and their Disposal. Aimed at addressing the gaps in plastic waste disposal, this treaty restricts participating nations from trading plastic scraps internationally, unless it lacks sufficient recycling or disposal capacity.
And over the last decade, the global plastic trade has indeed declined tremendously. But millions of tons of plastic are still being shipped (and mismanaged).
The post Charted: The Global Plastic Waste Trade appeared first on Visual Capitalist.