![]()
Published
1 hour ago
on
June 25, 2024
| 248 views
-->
By
Jenna Ross
Graphics & Design
- Athul Alexander
The following content is sponsored by GraniteShares
An investment in any ETF involves significant risk.
Swipe between images to see how leverage works for both long and short ETFs.
Charted: How Leverage Multiplies Stock Returns
Have you ever wondered how to increase your stock exposure? Beyond simply investing a higher amount, using leverage is an opportunity to multiply your returns.
This graphic, from GraniteShares, shows hypothetical examples of how leveraged ETFs can affect your returns compared to regular stock trades.
How Does Leverage Work?
If you have a strong belief that a company’s stock price will go up or down, single-stock leveraged ETFs can help you increase your short-term exposure. The ETFs aim to multiply a stock’s daily price changes by a certain percentage before fees and expenses.
Long ETFs
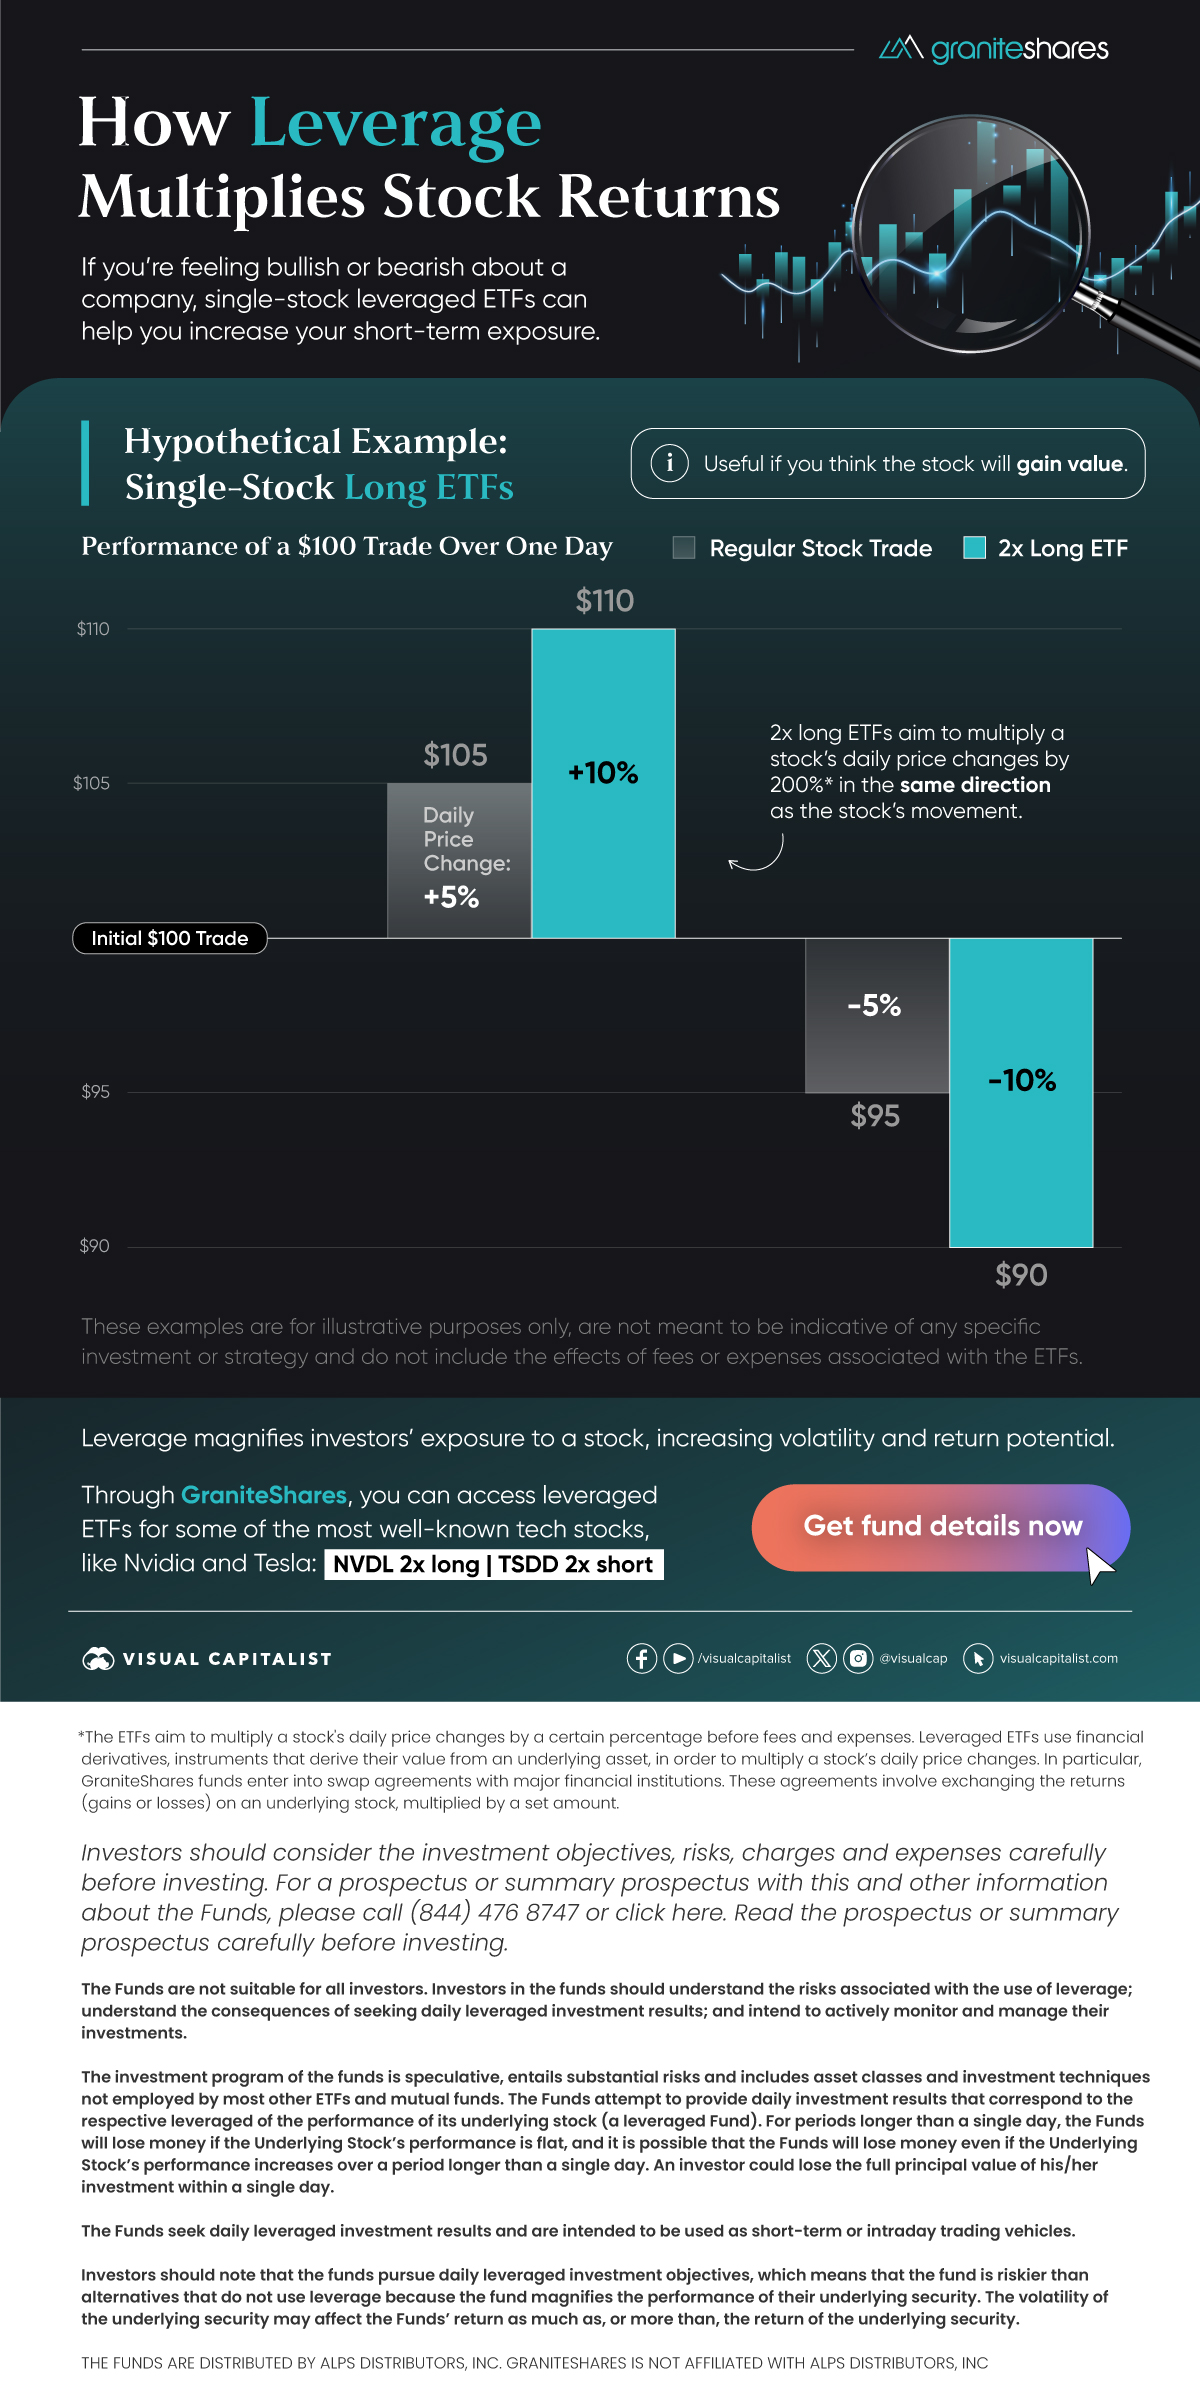
Single-stock long ETFs are useful if you think the stock will gain value. Here’s a hypothetical example of how a $100 trade might perform over a single day for two scenarios:
- The stock experienced a 5% gain
- The stock experienced a 5% loss
We’ve compared a regular stock trade to a 2x long ETF, which aims to multiply a stock’s daily price changes by 200% in the same direction as the stock’s movement.
| Stock Daily Price Movement | Ending Value of Initial $100 Stock Trade | 2x Long ETF Daily Price Movement | Ending Value of Initial $100 2x Long ETF Trade |
|---|---|---|---|
| +5% | $105 | +10% | $110 |
| -5% | $95 | -10% | $90 |
These examples are for illustrative purposes only, are not meant to be indicative of any specific investment or strategy and do not include the effects of fees or expenses associated with the ETFs.
When the stock gains 5%, the leverage of the 2x long ETF aims to double that gain for a daily return of 10%. On the flip side, if the stock goes down by 5%, the 2x long ETF could create a 10% loss for the investor.
Advertisement
Short ETFs
If you think a stock will lose value, single-stock short ETFs can be useful. Here’s a hypothetical example of how a $100 trade might perform over a single day for the same two scenarios.
We’ve compared a regular stock trade to a 2x short ETF, which aims to multiply a stock’s daily price changes by 200% in the opposite direction from the stock’s movement.
| Stock Daily Price Movement | Ending Value of Initial $100 Stock Trade | 2x Short ETF Daily Price Movement | Ending Value of Initial $100 2x Short ETF Trade |
|---|---|---|---|
| +5% | $105 | -10% | $90 |
| -5% | $95 | +10% | $110 |
These examples are for illustrative purposes only, are not meant to be indicative of any specific investment or strategy and do not include the effects of fees or expenses associated with the ETFs.
Get 2x short exposure to Tesla with GraniteShares’ TSDD ETF.
Here, you can see that a 5% stock gain can result in a 10% loss with the 2x short ETF. However, if the stock loses 5%, the 2x short ETF aims for a 10% gain.
Using Leverage to Magnify Stock Exposure
If you’re confident in the future direction of particular stocks and want to increase your exposure, leverage can be a useful tool. It multiplies stock returns, which means more volatility, but also higher return potential.
Ready to explore leveraged ETFs on well-known tech stocks? GraniteShares offers short and long positions for a variety of companies, like Nvidia and Tesla.
Get details on single-stock leveraged ETFs from GraniteShares.
Advertisement
Related Topics: #etf #long #short #GraniteShares #leverage
Click for Comments
var disqus_shortname = "visualcapitalist.disqus.com";
var disqus_title = "Charted: How Leverage Multiplies Stock Returns";
var disqus_url = "https://www.visualcapitalist.com/sp/gra01-how-leverage-multiplies-stock-returns/";
var disqus_identifier = "visualcapitalist.disqus.com-165674";
You may also like
-

Investor Education8 months ago
The 20 Most Common Investing Mistakes, in One Chart
Here are the most common investing mistakes to avoid, from emotionally-driven investing to paying too much in fees.
-

Stocks1 year ago
Visualizing BlackRock’s Top Equity Holdings
BlackRock is the world’s largest asset manager, with over $9 trillion in holdings. Here are the company’s top equity holdings.
-

Investor Education1 year ago
10-Year Annualized Forecasts for Major Asset Classes
This infographic visualizes 10-year annualized forecasts for both equities and fixed income using data from Vanguard.
-

Investor Education1 year ago
Visualizing 90 Years of Stock and Bond Portfolio Performance
How have investment returns for different portfolio allocations of stocks and bonds compared over the last 90 years?
-

Debt2 years ago
Countries with the Highest Default Risk in 2022
In this infographic, we examine new data that ranks the top 25 countries by their default risk.
-

Markets2 years ago
The Best Months for Stock Market Gains
This infographic analyzes over 30 years of stock market performance to identify the best and worst months for gains.
Subscribe
Please enable JavaScript in your browser to complete this form.Join the 375,000+ subscribers who receive our daily email *Sign Up
The post Charted: How Leverage Multiplies Stock Returns appeared first on Visual Capitalist.