![]()
See this visualization first on the Voronoi app.
Use This Visualization
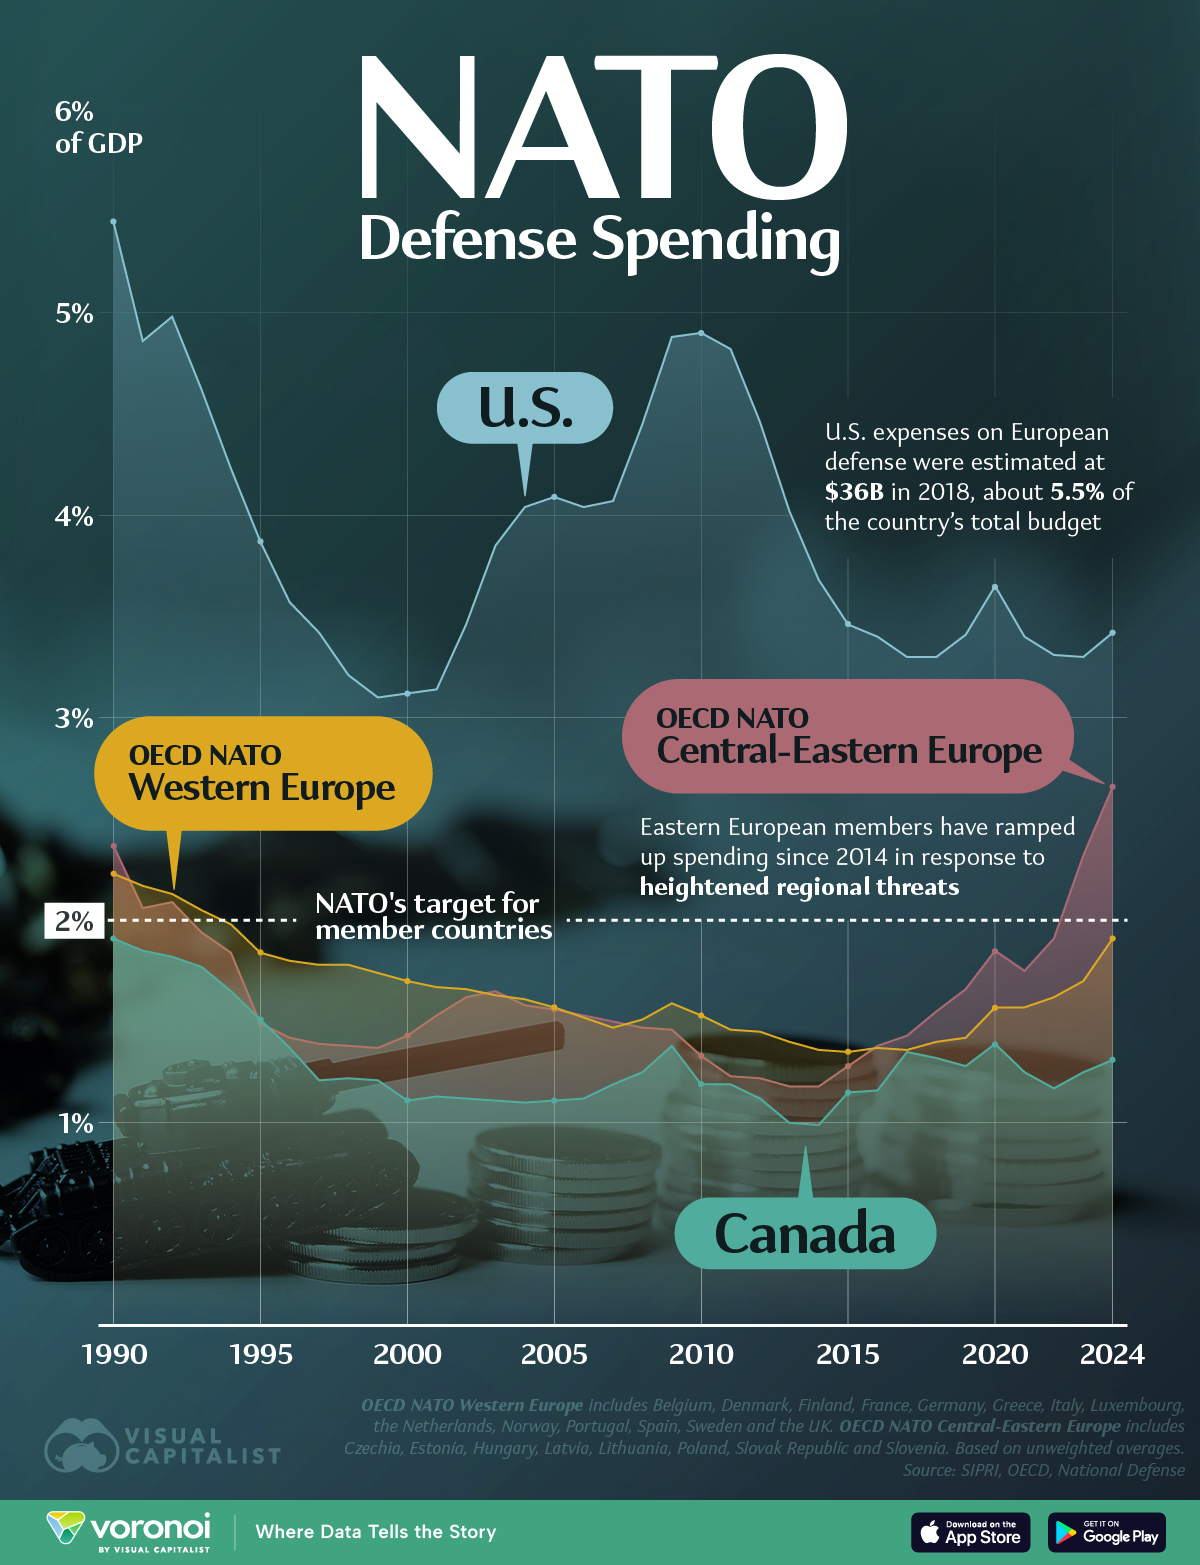
Charted: NATO Defense Spending as a Share of GDP
This was originally posted on our Voronoi app. Download the app for free on iOS or Android and discover incredible data-driven charts from a variety of trusted sources.
Key Takeaways
- The U.S. has consistently outspent other NATO regions on defense, maintaining levels above 3% of GDP since 2000
- Eastern European members have ramped up spending since 2014 in response to heightened regional threats
Since the end of the Cold War, NATO countries have adjusted their defense spending to match evolving geopolitical threats.
This chart visualizes defense expenditure as a percentage of GDP across major NATO regions: the U.S., Canada, Western Europe, and Central-Eastern Europe. It shows that while the U.S. has consistently maintained high defense spending, other NATO members have had more modest and varied trajectories.
Data & Discussion
The data for this visualization comes from SIPRI, accessed via the OECD Economic Outlook 2025.
Regions are broken out as follows, with figures representing unweighted averages for the economies in the group:
- OECD NATO Western Europe: Belgium, Denmark, Finland, France, Germany, Greece, Italy, Luxembourg, the Netherlands, Norway, Portugal, Spain, Sweden and the UK
- OECD NATO Central-Eastern Europe: Czechia, Estonia, Hungary, Latvia, Lithuania, Poland, Slovak Republic and Slovenia
| Year | USA | Canada | OECD NATO Western Europe |
OECD NATO Central-Eastern Europe |
|---|---|---|---|---|
| 1990 | 5.45% | 1.91% | 2.23% | 2.37% |
| 1991 | 4.86% | 1.85% | 2.17% | 2.06% |
| 1992 | 4.98% | 1.82% | 2.13% | 2.09% |
| 1993 | 4.62% | 1.77% | 2.05% | 1.94% |
| 1994 | 4.23% | 1.65% | 1.98% | 1.84% |
| 1995 | 3.87% | 1.51% | 1.84% | 1.49% |
| 1996 | 3.57% | 1.37% | 1.80% | 1.42% |
| 1997 | 3.42% | 1.21% | 1.78% | 1.39% |
| 1998 | 3.21% | 1.22% | 1.78% | 1.38% |
| 1999 | 3.10% | 1.21% | 1.74% | 1.37% |
| 2000 | 3.12% | 1.11% | 1.70% | 1.43% |
| 2001 | 3.14% | 1.13% | 1.67% | 1.53% |
| 2002 | 3.46% | 1.12% | 1.66% | 1.62% |
| 2003 | 3.85% | 1.11% | 1.63% | 1.65% |
| 2004 | 4.04% | 1.10% | 1.61% | 1.58% |
| 2005 | 4.09% | 1.11% | 1.57% | 1.56% |
| 2006 | 4.04% | 1.12% | 1.52% | 1.53% |
| 2007 | 4.07% | 1.19% | 1.47% | 1.50% |
| 2008 | 4.45% | 1.25% | 1.51% | 1.47% |
| 2009 | 4.88% | 1.38% | 1.59% | 1.46% |
| 2010 | 4.90% | 1.19% | 1.53% | 1.33% |
| 2011 | 4.82% | 1.19% | 1.46% | 1.23% |
| 2012 | 4.46% | 1.12% | 1.45% | 1.22% |
| 2013 | 4.02% | 1.00% | 1.40% | 1.18% |
| 2014 | 3.68% | 0.99% | 1.36% | 1.18% |
| 2015 | 3.46% | 1.15% | 1.35% | 1.28% |
| 2016 | 3.40% | 1.16% | 1.37% | 1.38% |
| 2017 | 3.30% | 1.35% | 1.36% | 1.43% |
| 2018 | 3.30% | 1.32% | 1.40% | 1.55% |
| 2019 | 3.41% | 1.28% | 1.42% | 1.66% |
| 2020 | 3.65% | 1.39% | 1.57% | 1.85% |
| 2021 | 3.40% | 1.25% | 1.57% | 1.75% |
| 2022 | 3.31% | 1.17% | 1.62% | 1.91% |
| 2023 | 3.30% | 1.25% | 1.70% | 2.32% |
| 2024 | 3.42% | 1.31% | 1.91% | 2.66% |
NATO Reveals a New 5% Target
Ahead of a major summit in The Hague, NATO member states have signed a new pledge that calls for allies to increase their defense spending to 5% of GDP by 2035.
The 5% would be broken down into 3.5% for military readiness, and 1.5% for cyber and infrastructure.
This is a significant increase from the previous 2% target, and something that U.S. President Donald Trump has been pushing for as part of his efforts to get European allies to shoulder more of the cost of their own defense. Notably, Trump has suggested that the 5% target would not apply to the U.S.
We’ve been supporting NATO so long. … So I don’t think we should, but I think that the NATO countries should, absolutely.
Past analysis has found that direct U.S. expenses on European defense amounted to $30.7 billion in 2017 and $36 billion in 2018. These amounts are equal to just over 5% of America’s total defense budget in each year.
Shifting Priorities in Central-Eastern Europe
An important trend highlighted in this chart is the increase in spending in Central and Eastern Europe following Russia’s 2014 annexation of Crimea.
The region’s average defense share grew from 1.18% in 2014, to 2.66% by 2024. This sharp increase signals heightened regional concerns over security and sovereignty, particularly in the wake of Russia’s invasion of Ukraine.
In a previous graphic, we highlighted how Poland, Estonia, and Lithuania are some of the leading spenders within NATO (as a % of GDP).
Learn More on the Voronoi App ![]()
If you enjoyed today’s post, check out this comparison of China and Taiwan’s militaries on Voronoi, the new app from Visual Capitalist.