![]()
See this visualization first on the Voronoi app.
Use This Visualization
The Rise of Stock Market Volatility (2017-2025)
This was originally posted on our Voronoi app. Download the app for free on iOS or Android and discover incredible data-driven charts from a variety of trusted sources.
The stock market, often perceived as a steady engine of wealth creation, is inherently prone to fluctuations known as volatility.
Volatility is a key indicator for investors looking to gauge risk and market sentiment, and in 2025 we’ve seen volatility rise amidst tariff announcements and other market-shifting catalysts.
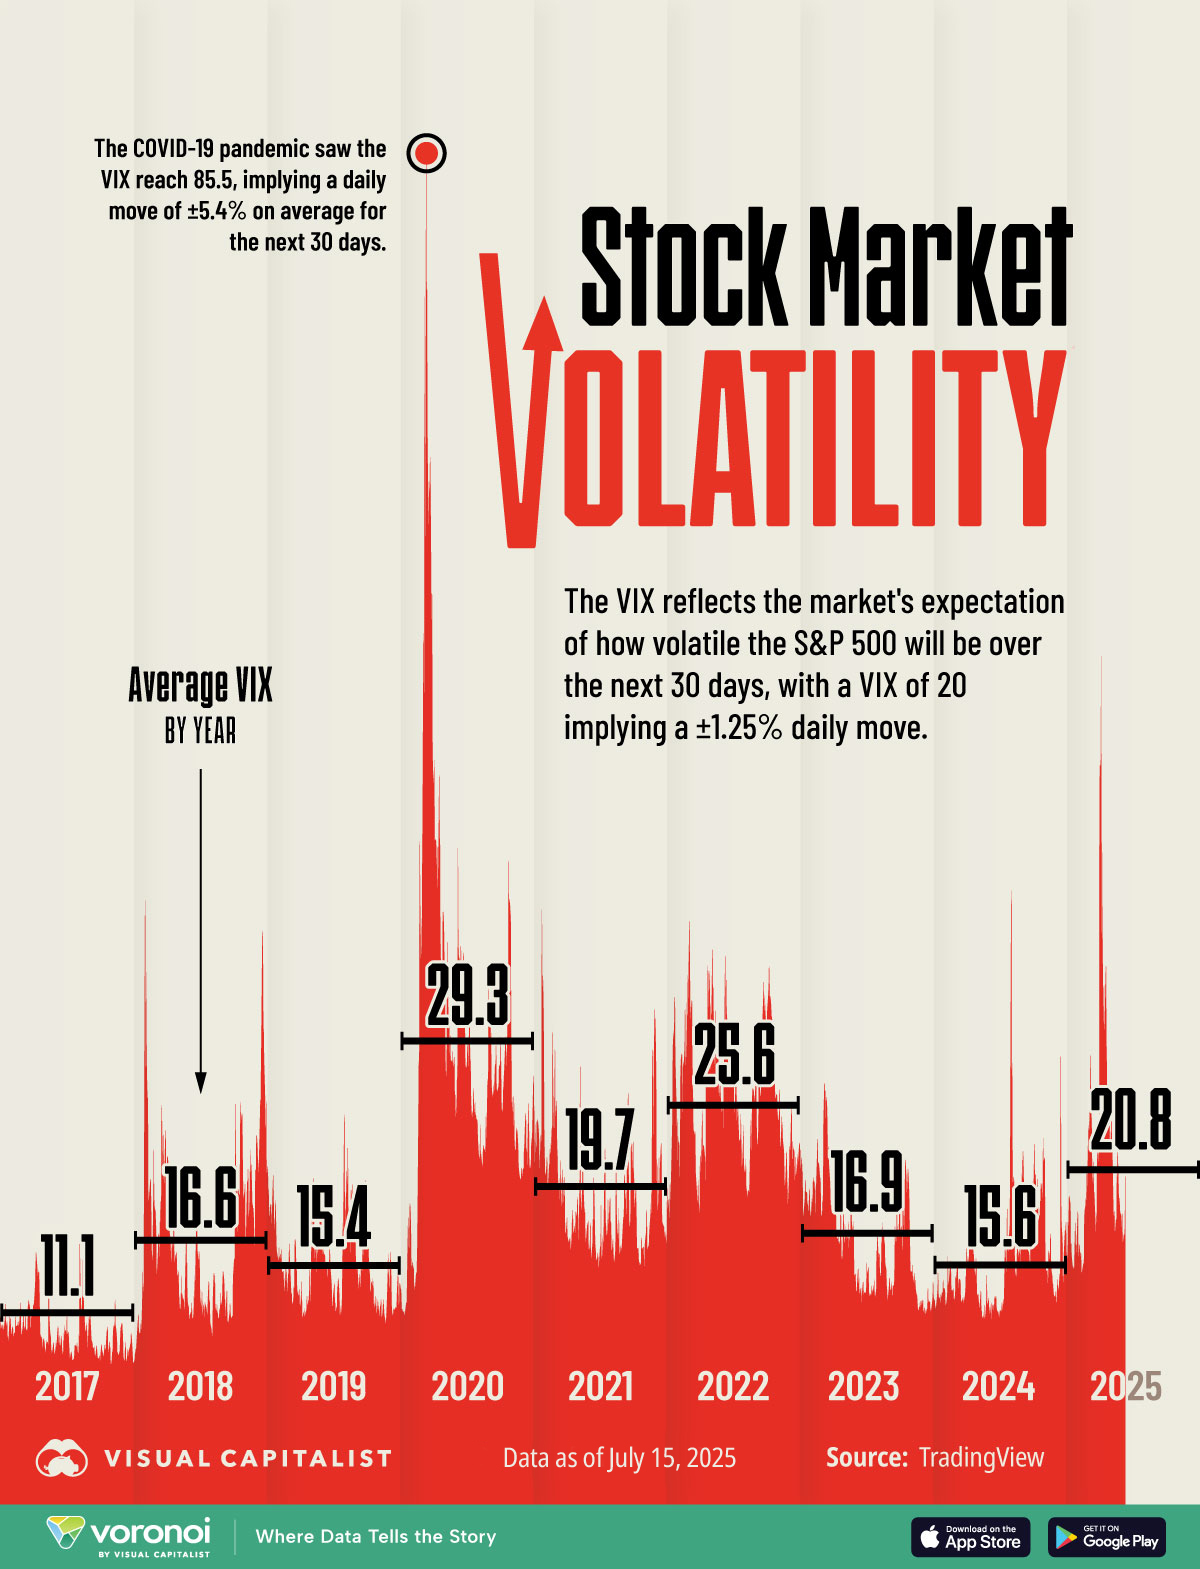
This chart visualizes the CBOE Volatility Index (VIX) from 2017 to July 2025, along with each calendar year’s average volatility using data from TradingView.
Understanding Rising Volatility in 2025
The VIX measures expected stock market volatility using the prices of options on the S&P 500. This is because when traders expect large moves in the market, options prices tend to rise as more options are purchased to bet on the direction of the move.
A VIX reading of 20 implies that the market expects about a 1.25% daily move (up or down) in the S&P 500 over the next 30 days.
While in 2023 and 2024 average volatility was fairly low at 16.9 and 15.6 respectively, we can see that in 2025 volatility has risen considerably.
| Year | Average Volatility (VIX) |
|---|---|
| 2017 | 11.1 |
| 2018 | 16.6 |
| 2019 | 15.4 |
| 2020 | 29.3 |
| 2021 | 19.7 |
| 2022 | 25.6 |
| 2023 | 16.9 |
| 2024 | 15.6 |
| 2025 YTD | 20.8 |
YTD data for 2025 is as of July 15th, and it’s already on track to be more volatile than six out of the past eight years. The only years with higher average volatility were 2020, when the COVID-19 pandemic’s onset saw volatility reach a high of 85.5, and in 2022, which featured recession fears amidst a significant slide downwards in tech stocks especially.
Volatility in 2025 was especially influenced by Donald Trump’s reciprocal tariff announcements in the first week of April, with the VIX spiking to a high of 60.1 as it grappled with the tariff announcement’s potential effects and aftershocks.
Since then, volatility has cooled off and now sits at 16.6, which implies daily stock market changes of 1.05% over the next 30 days. While the market seems to have gotten used to Trump’s rapid-fire announcements, we’ll be tracking the VIX to see if the second half of 2025 features more turbulence or smoother sailing for investors.
Learn More on the Voronoi App ![]()
To learn more about how the stock market has moved over the years, check out this graphic which charts the S&P 500’s intra-year declines and calendar year returns since 2001.