![]()
See this visualization first on the Voronoi app.
Use This Visualization
Charted: Spending Growth at the U.S. Department of Education
This was originally posted on our Voronoi app. Download the app for free on iOS or Android and discover incredible data-driven charts from a variety of trusted sources.
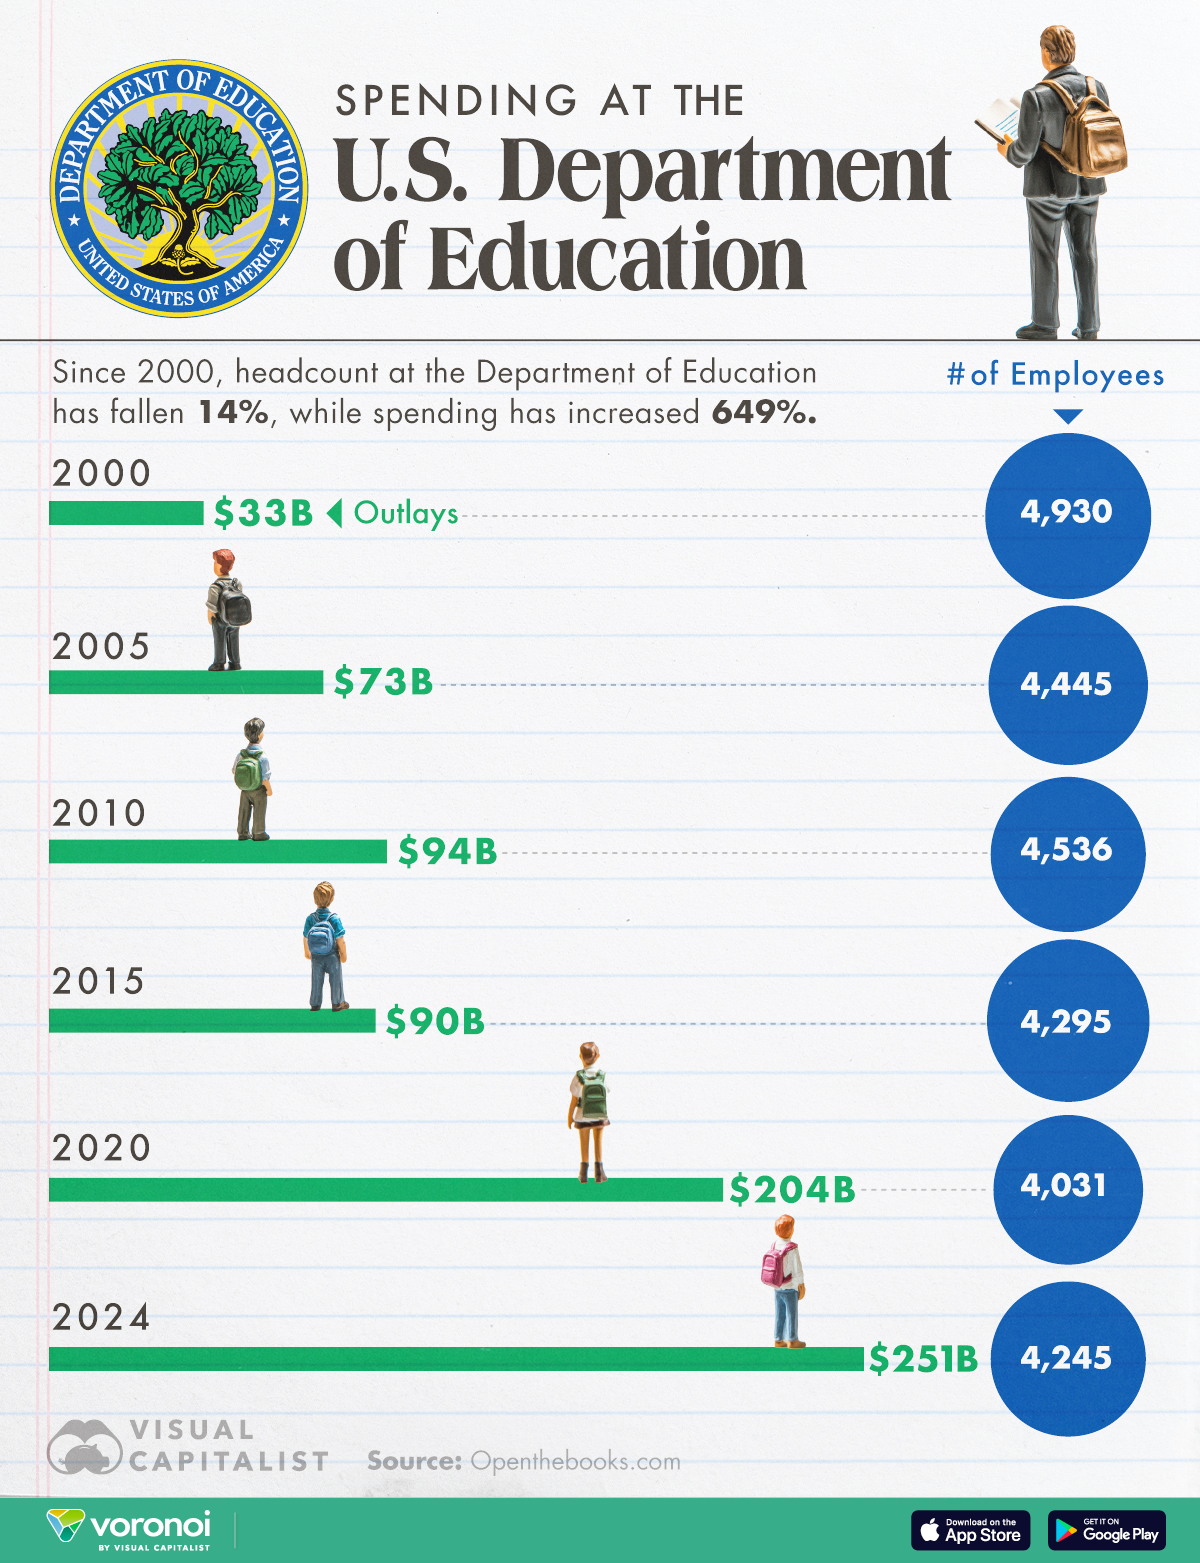
New data from Open The Books has revealed a dramatic increase in spending at the U.S. Department of Education, drawing the attention of the Trump administration’s cost-cutting efforts.
In this graphic, we visualize annual spending and headcount at America’s federal education department.
Data and Key Takeaways
The table below lists the numbers we used to create this graphic.
| Year | Employee Count | Annual Spending ($M) |
|---|---|---|
| 2000 | 4,930 | 33,476 |
| 2005 | 4,445 | 72,858 |
| 2010 | 4,536 | 93,743 |
| 2015 | 4,295 | 90,029 |
| 2020 | 4,031 | 204,416 |
| 2024 | 4,245 | 250,734 |
From this data we can see that the Department of Education has increased spending by 649% from 2000 to 2024, while headcount (# of employees) has fallen 14%.
DOGE Takes Aim
The U.S. government regularly spends more than it brings in, as we’ve visualized in the past.
As a result, many federal agencies have fallen into the crosshairs of Elon Musk’s DOGE (Department of Government Efficiency).
DOGE is facing legal roadblocks when it comes to the Education Department, though. On Feb. 24, a U.S. judge issued a temporary restraining order preventing DOGE from accessing sensitive data from the Department of Education.
This order is related to potential violations of the Privacy Act of 1974, as labor unions argue that it is unlawful for DOGE to gain access to employees’ personal information (e.g. Social Security numbers).
Going beyond spending cuts, President Donald Trump could try to abolish the Education Department entirely.
Abolishing the department would require the approval of Congress, which could be difficult given the Republicans’ narrow majority in the Senate.
Falling Academics
Many have become skeptical about how the Department of Education is spending money, given recent declines in academic performance.
For example, this interactive article from The74 highlights the downtrend in national NAEP math test scores, as well as the widening achievement gap between highest and lowest performing students.
Learn More on the Voronoi App ![]()
If you enjoyed this post, check out How Americans View Government Agencies on Voronoi, the new app from Visual Capitalist.
The post Charted: Spending Growth at the U.S. Department of Education appeared first on Visual Capitalist.