![]()
See this visualization first on the Voronoi app.
Use This Visualization
U.S. Home Listings Are Rising Across States
This was originally posted on our Voronoi app. Download the app for free on iOS or Android and discover incredible data-driven charts from a variety of trusted sources.
Key Takeaways
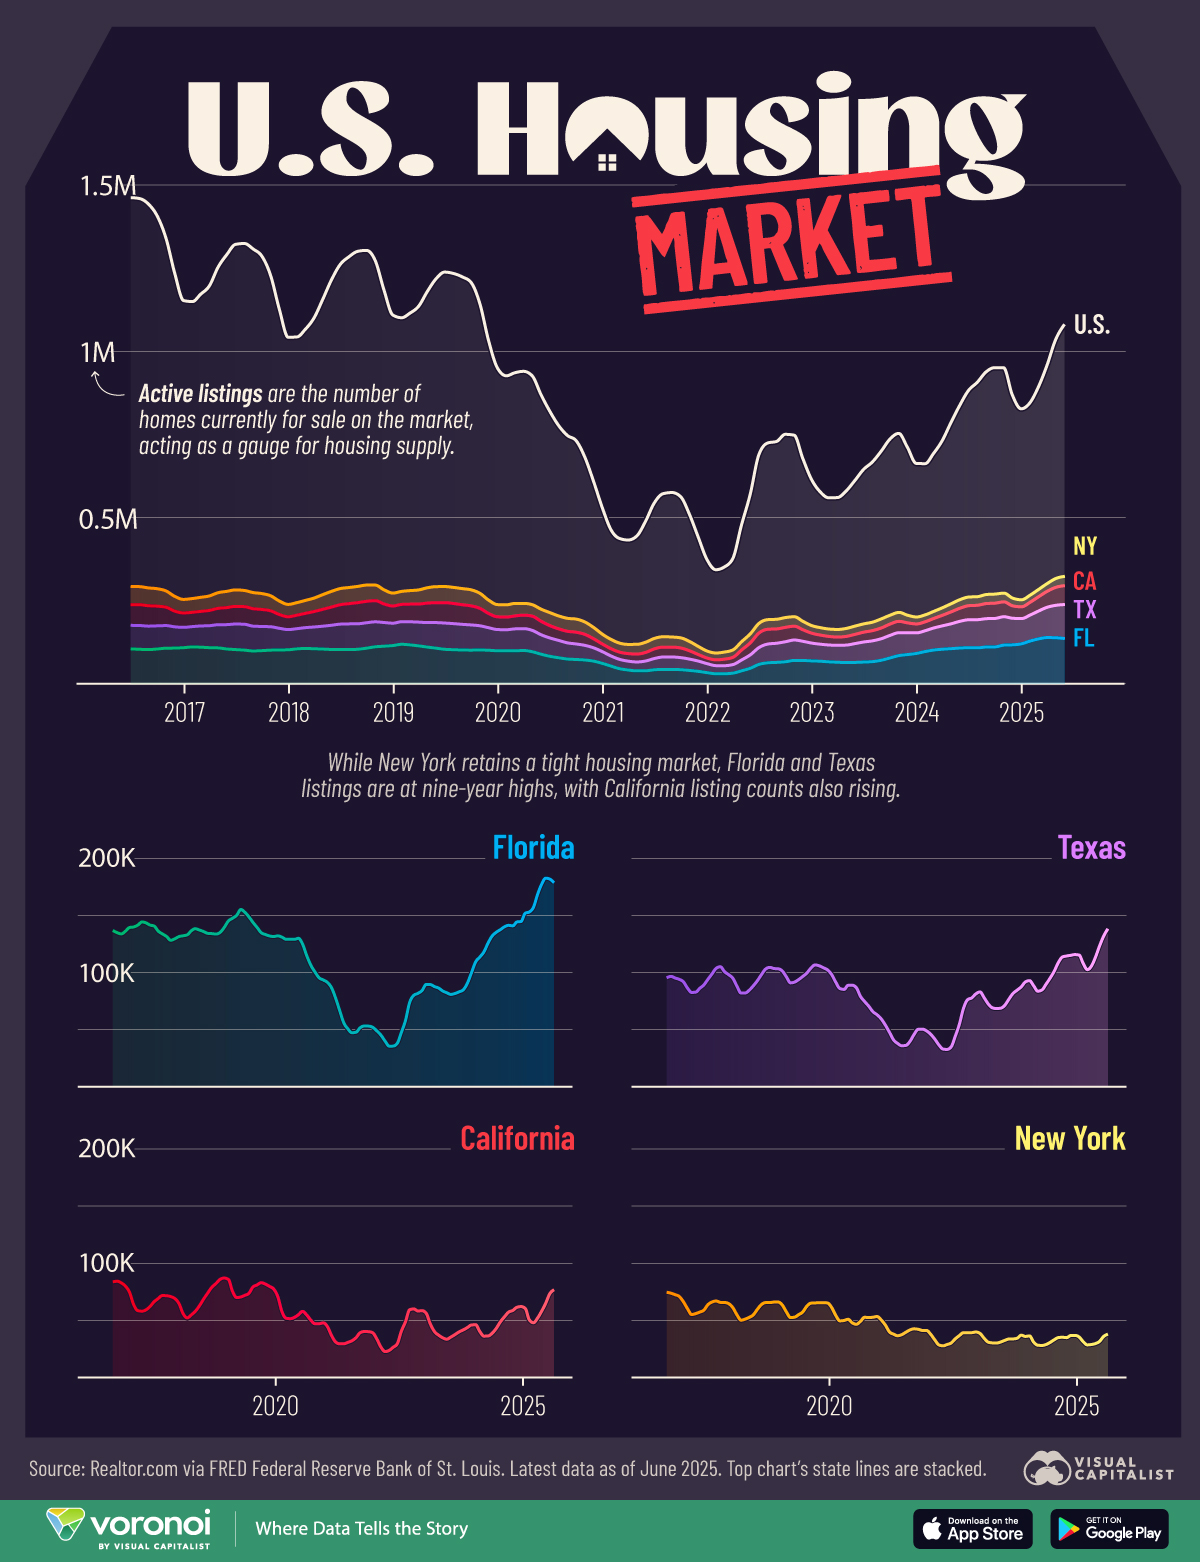
- Active listing counts in the U.S. have steadily risen since their recent low of 346K in 2022, now reaching almost 1.1 million as of June 2025.
- Listings in the states of Florida and Texas have reached nine-year highs, with California’s listings also trending upwards.
After hitting a low in 2022, the number of homes listed for sale across the U.S. has been climbing over the past three years, with states like Florida and Texas leading the rise.
The infographic breaks down the active home listings of the U.S. housing market since July 2016 to the latest data as of June 2025, highlighting key regional dynamics in the housing market.
The data for this visualization comes from the Federal Reserve Bank of St. Louis, which tracks monthly housing inventory levels nationally along with counts for the states of Florida, Texas, California, and New York.
America’s Housing Market Supply is Growing
Active listings, which measure the number of homes currently for sale, have climbed up from post-pandemic lows to above one million nationally.
A mix of easing mortgage lock-in, growing new construction, and investor offloading has helped rebuild supply, but the rebound is uneven and is threatening the growth of home prices in certain states.
| Date | U.S. | Florida | Texas | California | New York |
|---|---|---|---|---|---|
| July 2016 | 1,463,025 | 136,780 | 95,456 | 83,653 | 74,565 |
| January 2017 | 1,154,139 | 141,533 | 82,622 | 58,469 | 55,071 |
| July 2017 | 1,322,676 | 133,862 | 103,727 | 71,686 | 66,901 |
| January 2018 | 1,043,968 | 133,041 | 82,060 | 52,155 | 50,144 |
| July 2018 | 1,261,936 | 134,093 | 103,071 | 78,816 | 65,518 |
| January 2019 | 1,110,654 | 150,118 | 90,985 | 69,935 | 52,436 |
| July 2019 | 1,239,557 | 134,961 | 106,695 | 82,924 | 65,235 |
| January 2020 | 951,699 | 129,170 | 86,006 | 51,831 | 49,511 |
| July 2020 | 822,849 | 106,592 | 74,650 | 50,226 | 52,671 |
| January 2021 | 531,780 | 77,534 | 47,616 | 30,995 | 39,831 |
| July 2021 | 546,697 | 51,689 | 45,796 | 39,163 | 42,544 |
| January 2022 | 376,973 | 39,961 | 36,614 | 22,698 | 28,495 |
| July 2022 | 691,663 | 73,645 | 68,582 | 59,196 | 39,156 |
| January 2023 | 616,869 | 87,717 | 72,413 | 40,126 | 30,837 |
| July 2023 | 647,145 | 83,090 | 81,594 | 39,845 | 33,717 |
| January 2024 | 665,603 | 118,163 | 83,701 | 36,174 | 28,234 |
| July 2024 | 883,905 | 141,334 | 113,622 | 57,148 | 35,155 |
| January 2025 | 829,376 | 157,221 | 102,552 | 47,924 | 28,510 |
| June 2025 | 1,082,520 | 178,636 | 138,255 | 76,737 | 37,875 |
Florida’s surge reflects climate risks, insurance spikes, and heavy homebuilding, particularly in metro areas like Tampa and Jacksonville. The state’s recent 4% drop in home prices was the biggest decline in single-family home prices since October 2011.
Texas, long known for permissive building policies, has a similar trend: resilient construction pipelines now outpacing demand, especially as higher mortgage and tax burdens push owners to list.
The housing market of the state’s capital city, Austin, saw a 5.8% YoY drop in the number of homes sold in May 2025 along with a 2% median price drop.
California, while showing a rise in inventory, remains well below pre-pandemic levels. High land and construction costs, combined with entrenched zoning restrictions, keep supply tight.
New York is even more restrained. Co-op rules, limited resale inventory, and homeowners locked into low mortgage rates have kept listings near record lows, especially in downstate markets.
With inventory coming back mostly in the Sun Belt, buyers there are gaining leverage with more choices at lower prices.
Learn More on the Voronoi App ![]()
To learn more about the U.S. housing market, check out this graphic that compares income, house prices, and mortgage rates in 2025 to those in 1985.