![]()
See this visualization first on the Voronoi app.
Use This Visualization
The U.S. National Debt Reaches $35 Trillion
This was originally posted on our Voronoi app. Download the app for free on iOS or Android and discover incredible data-driven charts from a variety of trusted sources.
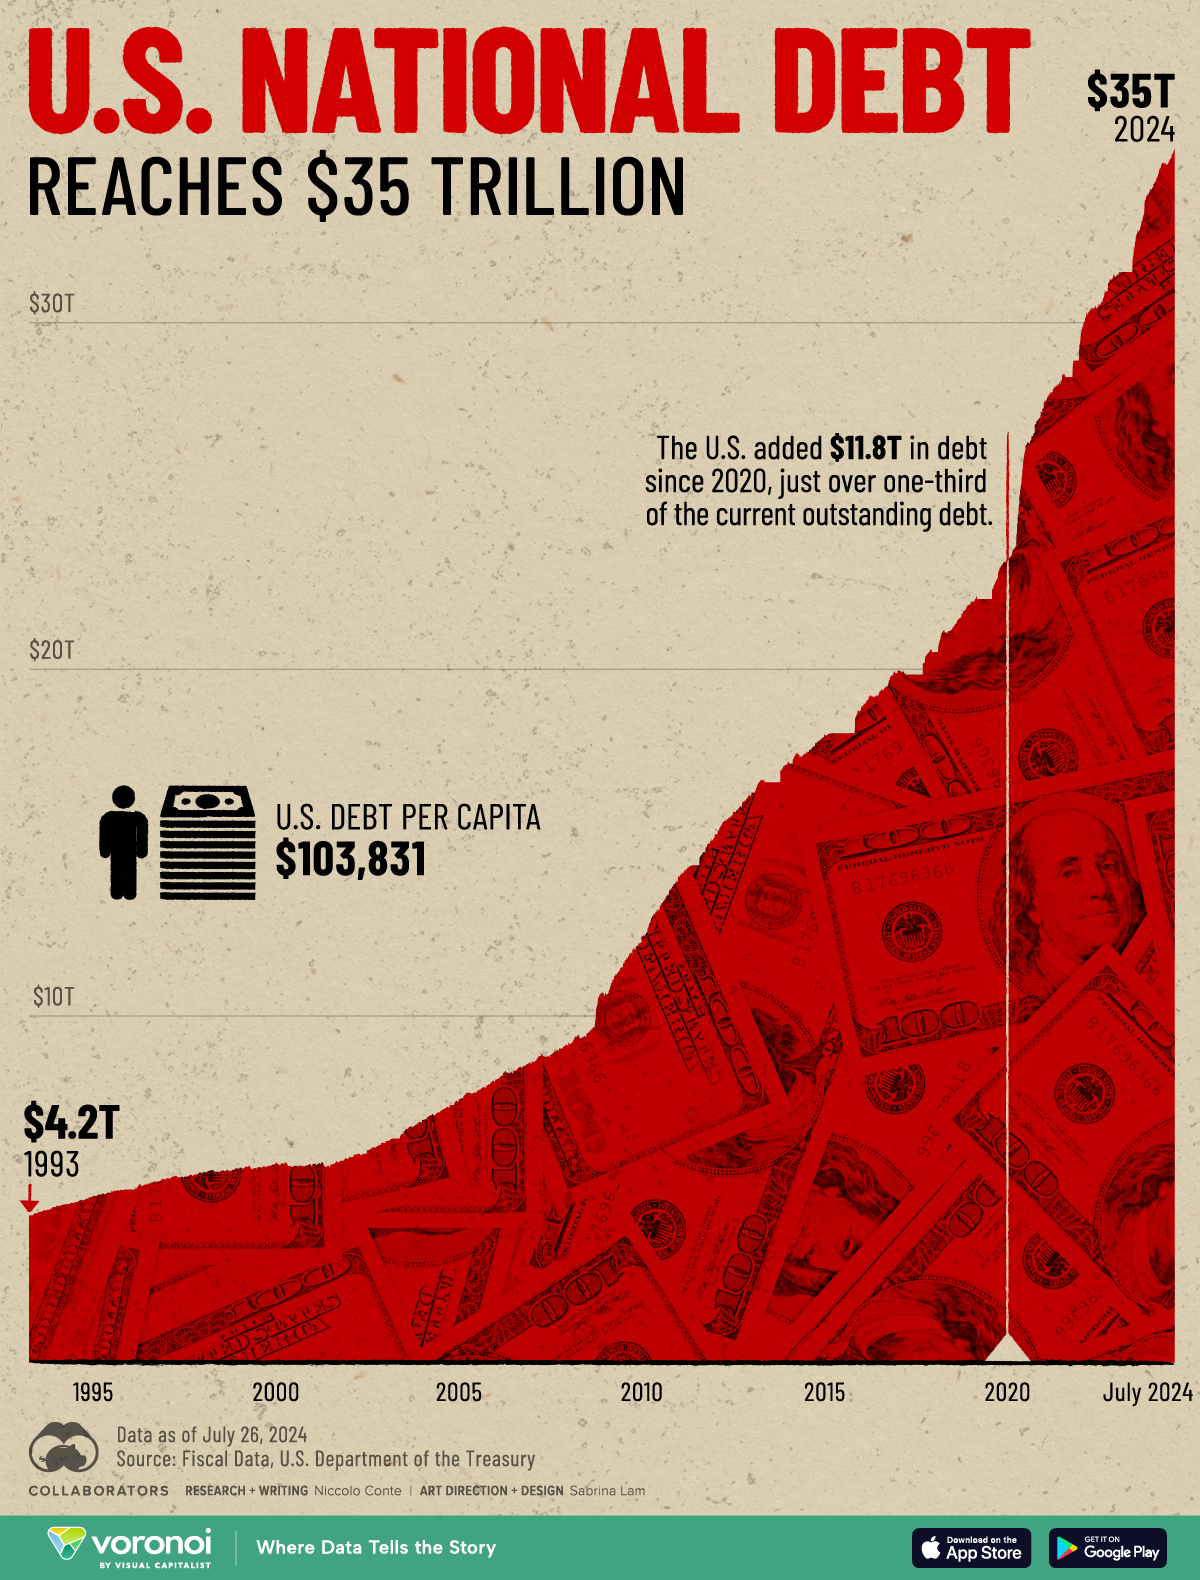
The U.S. national debt hit a new $35 trillion landmark, just halfway into 2024.
Since January, the U.S. debt pile has expanded by $1 trillion alone, moving the debt-to-GDP ratio to 98%. By 2032, the International Monetary Fund projects that this ratio could surpass 140% under current policies. Despite the looming threat to U.S. fiscal sustainability, neither Republican or Democratic parties show political incentive to address the rapid pace of borrowing.
This graphic shows the ballooning U.S. national debt, based on figures from the U.S. Department of the Treasury’s Fiscal Data website.
A New Milestone is Reached
Today, the U.S. national debt is equal to the GDP of China, Japan, Germany, India, and the United Kingdom combined.
Since 2020, the U.S. has added $11.8 trillion to its national debt, accounting for more than one-third of the current total. For perspective, government debt stood at $9.2 trillion in 2008 and in 1981, it crossed the $1 trillion mark for the first time.
| Date | Total Public Debt Outstanding |
|---|---|
| 2024 YTD* | $35.0T |
| 2024 | $34.0T |
| 2023 | $31.4T |
| 2022 | $29.6T |
| 2021 | $27.7T |
| 2020 | $23.2T |
| 2019 | $22.0T |
| 2018 | $20.5T |
| 2017 | $20.0T |
| 2016 | $18.9T |
| 2015 | $18.1T |
| 2014 | $17.2T |
| 2013 | $16.4T |
| 2012 | $15.2T |
| 2011 | $14.0T |
| 2010 | $12.3T |
| 2009 | $10.7T |
| 2008 | $9.2T |
| 2007 | $8.7T |
| 2006 | $8.2T |
| 2005 | $7.6T |
| 2004 | $7.0T |
| 2003 | $6.4T |
| 2002 | $5.9T |
| 2001 | $5.7T |
| 2000 | $5.8T |
| 1999 | $5.6T |
| 1998 | $5.5T |
| 1997 | $5.3T |
| 1996 | $5.0T |
| 1995 | $4.8T |
| 1994 | $4.5T |
| 1993 | $4.2T |
*Data as of July 26, 2024. Represents figures at the start of each year.
Looking at it another way, the Biden administration has added $7.2 trillion to the U.S. national debt, coming second-only to the Trump administration, at $7.8 trillion.
As a result, the cost of servicing government debt is surging. In 2024, interest costs on the national debt are forecast to reach 17% of federal spending, making it the fastest growing expense overall. These interest costs are expected to escalate further as higher interest rates drive up the cost of new borrowing.
Despite this mounting fiscal pressure, neither political party has proposed meaningful strategies to address the growing debt. This has negative consequences to the U.S. economy, since funds spent on debt interest costs are diverted away from other areas that could benefit the economy, such as infrastructure or Social Security.
Moreover, if the government can’t make interest payments, it could jeopardize the dollar’s status as the world’s reserve currency. This scenario could weaken the dollar and trigger a liquidity crisis, with broader economic impacts.
The post Charted: U.S. National Debt Reaches $35 Trillion appeared first on Visual Capitalist.